Investment Thesis
This article initiates coverage on the Capital Group Growth ETF (NYSEARCA:CGGR), a relatively new, actively managed fund predominantly investing in larger, faster-growing U.S. companies with attractive valuations. After evaluating the Capital Group Dividend Value ETF (CGDV), which also operates under the principles of The Capital System, I was intrigued and impressed with the group’s multi-manager approach, and I wanted to see how it applied well to growth stocks. In this article, I will evaluate CGGR’s fundamentals alongside passive, low-cost alternatives like the SPDR Portfolio S&P 500 Growth ETF (SPYG) and the Vanguard Growth ETF (VUG). Briefly, CGGR has a good combination of valuation and growth but makes too many sacrifices on quality. As a result, I’ve set my rating on CGGR to “hold,” and I look forward to explaining why in more detail below.
CGGR Overview
Strategy Discussion and Fund Facts
The investment adviser to the fund is the Capital Research and Management Company, which includes six portfolio managers, as follows:
- Paul Benjamin: Partner, Capital World Investors
- Mark L. Casey: Partner, Capital International Investors
- Irfan M. Furniturewala: Partner, Capital International Investors
- Anne-Marie Peterson: Partner, Capital World Investors
- Andraz Razen: Partner, Capital World Investors
- Alan J. Wilson: Partner, Capital World Investors
Like with CGDV, each portfolio manager is responsible for a portion of the fund, leveraging their expertise and backgrounds in specific sectors, industries, and geographies. For example, Mr. Benjamin’s research relates to large-cap software companies, while Ms. Peterson started her career with Capital Group 18 years ago as an equity investment analyst covering U.S. retail and restaurants. Manager diversification is beneficial for actively managed funds, as it helps to reduce bias and, ultimately, risk.
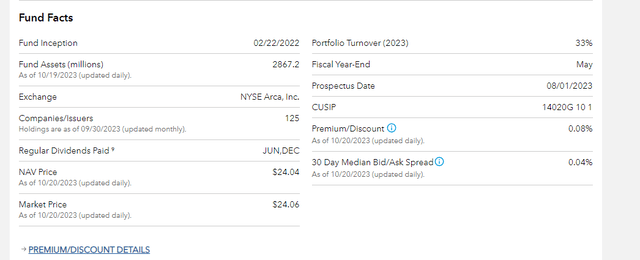
CGGR launched on February 22, 2022, has a 0.39% expense ratio and a reasonably small 0.04% 30-day median bid-ask spread. Other fund facts are listed below, courtesy of Capital Group.
Capital Group
Of particular interest is CGGR’s 33% portfolio turnover rate, which is smaller than what you might expect for an actively managed fund. I’ve learned that The Capital System operates with high conviction, so although holdings can change, they likely won’t be drastic. Therefore, I hope to get a good idea of the managers’ styles by evaluating CGGR’s current fundamentals, but first, let’s look briefly at the fund’s performance since its inception.
Performance
The following table highlights CGGR’s performance since March 2022 alongside SPYG and VUG. Annualized returns were -2.19%, which falls right in the middle.
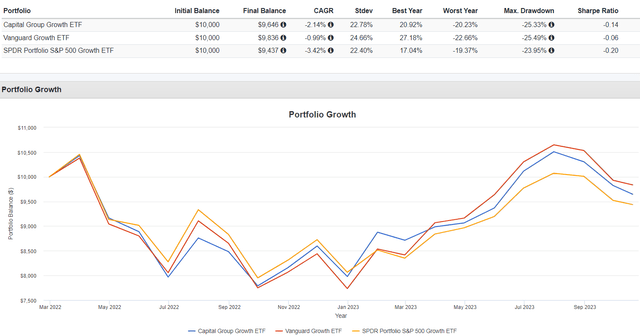
Portfolio Visualizer
In 2023 through September, CGGR’s 23.23% gain ranked #24/49 among all/large-cap growth ETFs. The Fidelity Blue Chip Growth ETF (FBCG) led the way, which isn’t surprising, given how it’s one of the most aggressive growth funds I’ve encountered. At the bottom was the Invesco S&P Pure Growth ETF (RPG), which has underperformed because it avoids most mega-cap stocks, as discussed here. Based on this limited analysis, CGGR appears to be a middle-of-the-road growth fund with the potential benefits of active management.
Finally, consider how, for the 20 months since March 2022, CGGR outperformed VUG and SPYG 11 and 12 times, respectively. In most months, all three ETFs delivered similar returns. However, CGGR underperformed by 2.57% on average in June 2022, July 2022, and March 2023, while beating SPYG by 5.68% in January 2023. Otherwise, there’s little to report on CGGR’s short track record, so I want to focus primarily on its fundamentals for the remainder of this article. Let’s look at the next.
CGGR Analysis
Sector Exposures and Top Ten Holdings
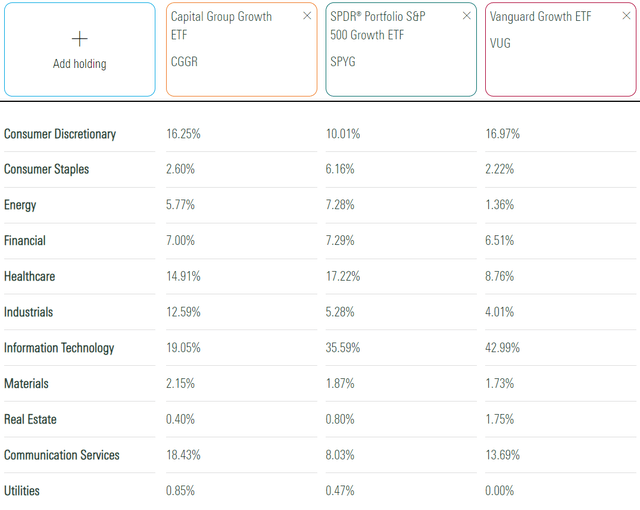
The following table highlights sector exposure differences for CGGR, SPYG, and VUG. The main takeaway is CGGR’s superior diversification, with about half the exposure to Technology stocks. In exchange, it has higher exposure to Communication Services, which is mainly Meta Platforms (META), Netflix (NFLX), and Alphabet (GOOGL).
Morningstar
The primary cause for CGGR’s lower Technology exposure is a minimal 0.88% exposure to Apple (AAPL), about 12% less than SPYG and VUG. Apple has a relatively unattractive 2.99 forward PEG ratio, while overweighted stocks like Meta Platforms and Netflix have ratios of 1.05 and 1.43, respectively. There are examples of CGGR underweighting stocks with attractive PEG ratios (NVDA, GOOGL), but overall, CGGR’s weighted average forward PEG ratio is 2.06 vs. 2.35 and 2.29 for SPYG and VUG. Therefore, managers consider value alongside growth, consistent with the investment objectives stated in the fund’s prospectus.
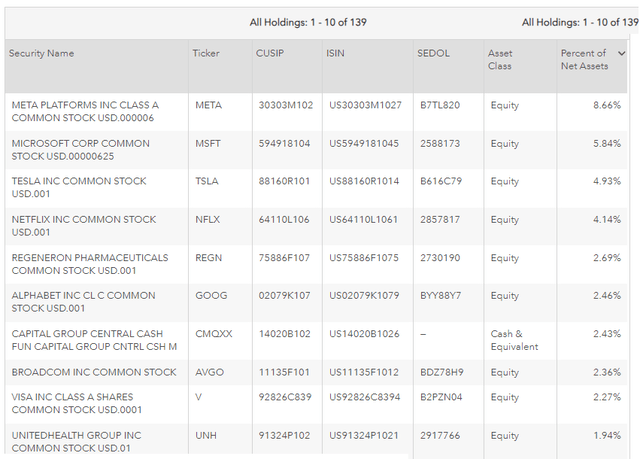
CGGR’s top ten holdings are listed below, which include 2.43% allocated to the Capital Group Central Cash Fund (CMQXX). Microsoft (MSFT) is also prominent, but its 5.84% weighting is about 3.67% less than its peers.
Capital Group
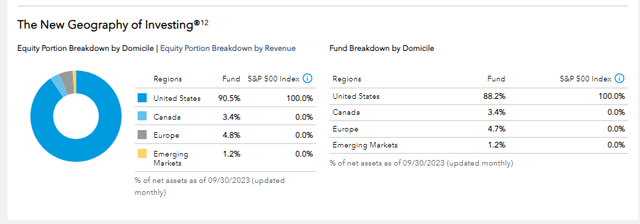
Diversification appears to be a hallmark of The Capital System. CGGR holds 139 securities, 130 of which are equities. In addition, managers can invest up to 25% of assets outside of the U.S. Currently, that figure is about 10% and includes investments in securities like Canadian Natural Resources (CNQ) and Adidas (OTCQX:ADDYY).
Capital Group
CGGR Fundamentals
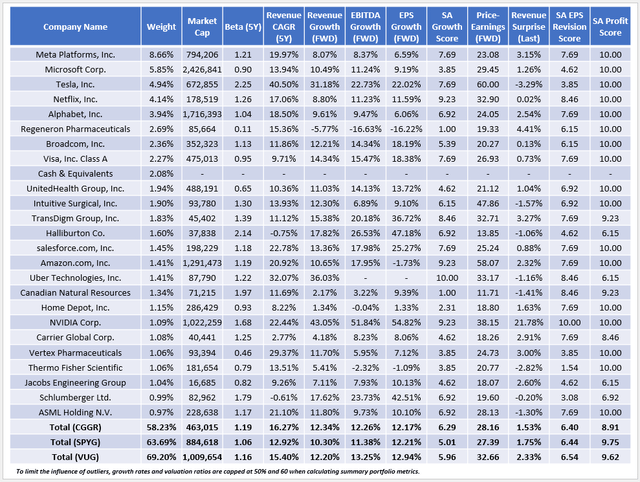
The following table highlights selected fundamentals for CGGR’s top 25 holdings, totaling 58.23%. I’ve also included summary metrics for VUG and SPYG in the bottom rows.
The Sunday Investor
I want to make a few observations:
1. CGGR’s $463 billion weighted average market capitalization is about half of what SPYG and VUG feature, mainly due to it underweighting mega-caps like Apple and Microsoft. The result is better diversification, as its percentage of assets in its top 25 holdings is 5-10% less than SPYG and VUG. CGGR has 8.33% exposure to non-large-cap stocks with market caps below $14 billion, while SPYG’s allocation to these stocks is minimal at 1.02% and 1.27%. This partly explains CGGR’s higher 1.19 five-year beta, as smaller companies tend to be more volatile.
2. CGGR’s holdings have an impressive weighted average 16.27% historical sales growth rate vs. 12.92% and 15.48% for SPYG and VUG. However, that advantage disappears on forward-looking metrics, including the fund’s 12.17% estimated EPS growth rate. Meta Platform’s 6.59% growth rate is one source, as is the negative 16.22% rate for Regeneron Pharmaceuticals (REGN).
3. A concerning metric is how 9.33% of the fund’s constituents by weight have negative trailing net income margins, including Uber Technologies (UBER) and Cloudflare (NET). These companies have great three-year sales growth rates of 47.84% and 43.30%, with similarly high expectations. However, poor profits have weighed on performance, delivering total returns of just 18.31% and 4.07% over the last three years. Based on a relatively weak 8.91/10 Seeking Alpha Profit Score, I’m concerned that managers have sacrificed too much quality for a better growth/valuation combination. To illustrate, CGGR constituents with Seeking Alpha Profit Grades of “A” or above have delivered a 40.21% median total return over the last three years compared to 11.02% for companies with “A-” Grades or below. Logically, it makes more sense to overweight the most profitable companies, and I wish CGGR managers prioritized that factor more.
Investment Recommendation
The last observation is why I set a “hold” rating on CGGR. Based on a relatively low 33% portfolio turnover, I assume this represents the fund’s style, and it’s why it’s been a mediocre investment since its launch. The benefits include the fund’s diverse multi-manager approach and a solid combination of valuation and growth. However, many other low-fee options are available, and jumping in quickly is unnecessary. Thank you for reading, and I look forward to the comments below.
Read the full article here


Leave a Reply