Welcome to another installment of our CEF Market Weekly Review, where we discuss closed-end fund (“CEF”) market activity from both the bottom-up – highlighting individual fund news and events – as well as the top-down – providing an overview of the broader market. We also try to provide some historical context as well as the relevant themes that look to be driving markets or that investors ought to be mindful of.
This update covers the period through the fourth week of September. Be sure to check out our other weekly updates covering the business development company (“BDC”) as well as the preferreds/baby bond markets for perspectives across the broader income space.
Market Action
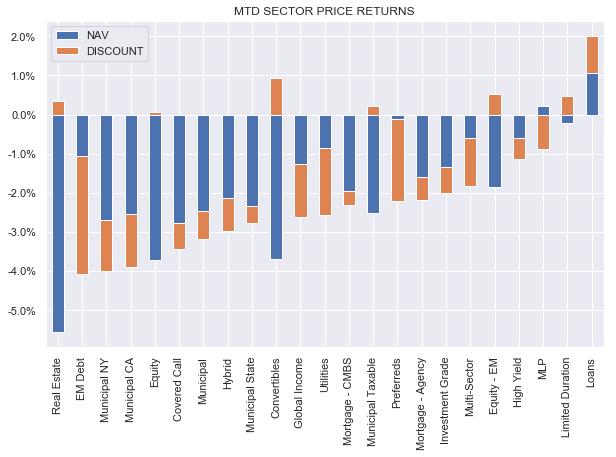
This past week brought lower NAVs across all CEF sectors due to the higher-for-longer message from the Fed however discounts managed to hold up well, tightening for all but a handful of sectors. Loans, and Limited Duration sectors outperformed. These are the only two sectors that also remain in the green for the month.
Systematic Income
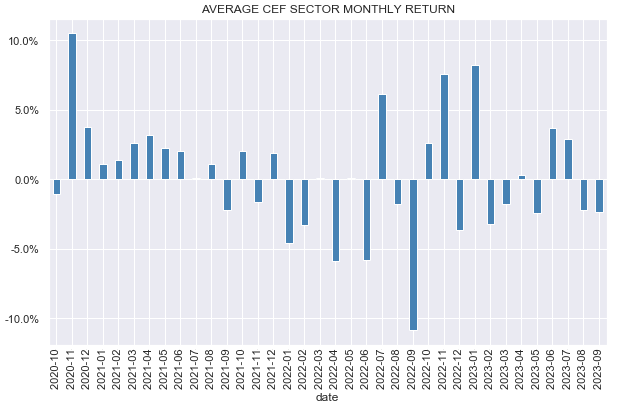
September is shaping up to be another down month in a row for CEFs after strong June and July.
Systematic Income
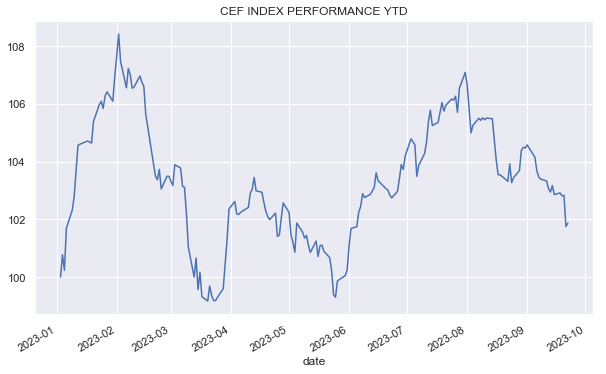
Recent weakness in the space means that this is the third CEF rally this year that has not been sustained.
Systematic Income
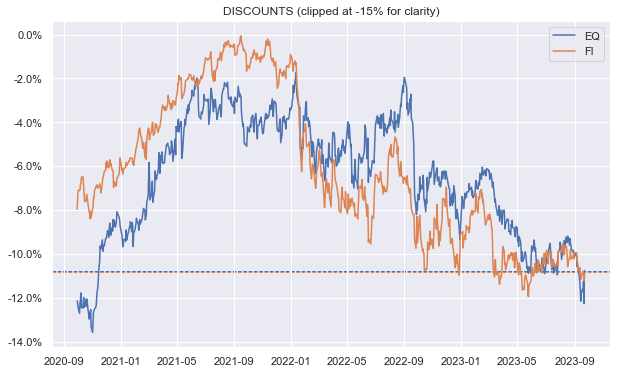
Although discounts enjoyed a bounce this week, they remain fairly wide relative to the past few years.
Systematic Income
Market Themes
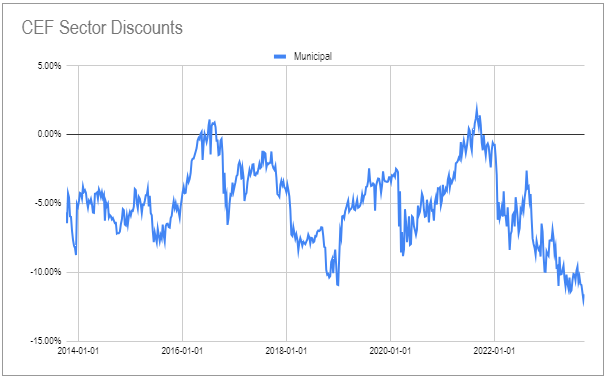
In response to our recent commentary, there was a question of whether the higher cost of leverage (and a lower level of net interest margin on leveraged assets) was the direct cause of wide Muni CEF discounts. Recall that Muni CEF discounts are trading at very depressed levels as shown below.
Systematic Income CEF Tool
This is a perceptive question, and it makes a lot of sense intuitively. However, while there is some element of truth here, it is far from the entire story.
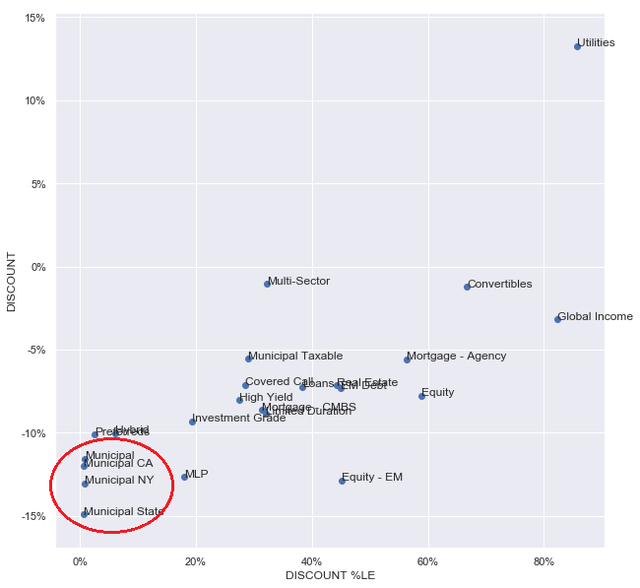
If it were the entire story we would see similarly wide discounts for other fixed-income CEF sectors like High Yield, Investment-Grade, Agencies, Global Income and others which we don’t.
Systematic Income
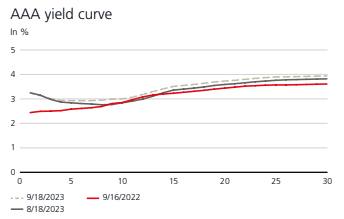
In fact, net interest margin has compressed more for these sectors than for tax-exempt Munis as the Treasury yield curve is inverted while the tax-exempt curve is still upward sloping.
UBS
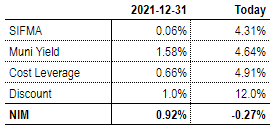
Let’s take a look at Muni net interest margin. There is no single metric that will be appropriate for all sector CEFs given their slightly different sub-sector and rating focus however for our purpose here we can use the S&P Long Term Municipal Bond Index as a proxy for the relevant bond yield and SIFMA + 0.6% as a proxy for the cost of leverage.
Once we run the numbers, we see that net interest margin (Muni Yield – Cost of Leverage) today is -0.27% versus +0.92% at the end of 2021. In other words, Muni CEF leverage today subtracts around 0.27% from the fund’s underlying portfolio yield (before the impact of management fees) but added around 0.92% at the end of 2021.
Systematic Income
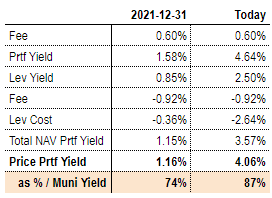
However, there is more to the story here than leverage cost. Specifically, because underlying bond yields are significantly higher today than they were at the end of 2021, management fees as a ratio of the portfolio yield are considerably lower.
If we run the numbers what we see is that the portfolio yield on price today is 4.06% (using our proxies) which is 87% of the underlying bond yield versus being only 74% of the underlying bond yield at the end of 2021. In other words, more of the underlying bond yield is passed onto Muni CEF investors today than at the end of 2021. Using this logic, discounts “should” be tighter today than at the end of 2021.
Systematic Income
Overall however, CEF discounts in the market are driven much more by returns and investor sentiment rather than fair-value calculations like these. And as Muni CEFs have underperformed since 2022 due to their high duration and a low level of carry, their discounts have widened significantly and it’s this rather than fair-value that explains wide discounts. The upshot here is that investors who do understand this fair-value dynamic can take advantage of investor sentiment and allocate to CEFs on a more rational basis.
Market Commentary
Emerging Market credit CEFs EDD and MSD raised their distributions. Although both allocate to EM debt, the focus is slightly different as MSD allocates to eurobonds (i.e. bonds issued in hard currency) while EDD allocates primarily to local-currency bonds, though it appears to hedge some of the FX exposure. MSD is unleveraged while EDD is lightly leveraged, so they have not been hurt very much by the rise in leverage cost. Both funds are overdistributing somewhat relative to their new distributions.
EM currencies have rallied recently, so that should help drive EDD net income higher. MSD can benefit from rotating its lower-coupon into higher-coupon bonds, those that have been issued since 2022, to push its net income higher.
Overall, EM debt remains a tough one to own, particularly the local-currency flavor even if it’s appealing on fundamental grounds because diversification is generally poor (particularly for sovereign funds). It can also be difficult for investors to keep conviction around these funds during sell-offs, as they typically have little familiarity or direct knowledge about the asset class.
CEF Tool Update
This week we made two changes to our CEF Tool.
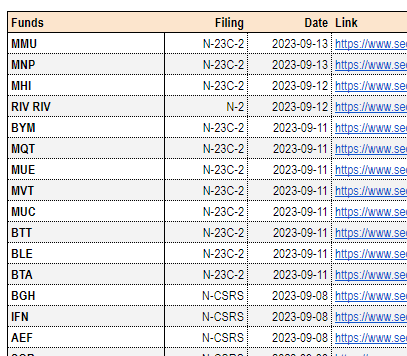
First, there was an update to the Filings tab of the CEF Tool, which shows various SEC filings made by CEFs. Until recently the tab only listed semi-annual shareholder reports as there are a ton of different filings and each type takes quite a bit of time to download. This was expanded to share offerings (N-2 type filing) as well as tender offers (SC type filing) so these can be tracked by more tactically minded investors.
Systematic Income CEF Tool
And second, the new CLO CEF CCIF was added to the CLO funds tab in the CEF Tool. CCIF, alongside the handful of other CLO funds, get this special treatment because their NAVs are released only monthly. The CLO Funds tab shows these funds’ yields, latest NAVs as well as estimated NAVs which are based on other funds with partial CLO holdings (e.g. XFLT, ARDC) that release daily NAVs.

Systematic Income CEF Tool
Investors can also track the discount of CCIF and other CLO funds over time.

Systematic Income CEF Tool
Editor’s Note: This article covers one or more microcap stocks. Please be aware of the risks associated with these stocks.
Read the full article here


Leave a Reply