Interest rates have been surging at the fastest rate in over 20 years.
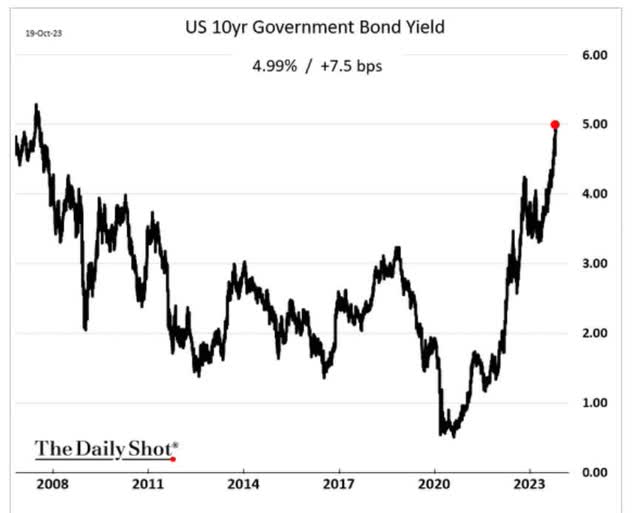
Daily Shot
For high-yield “bond alternative” sectors like real estate investment trusts aka REITs, utilities, and yieldCos, it’s been carnage.
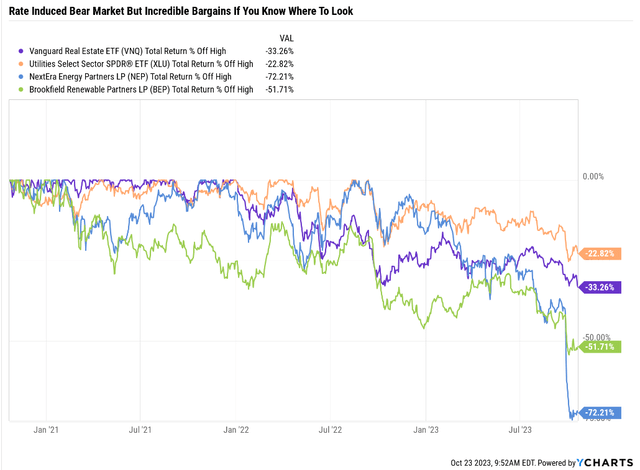
Ycharts
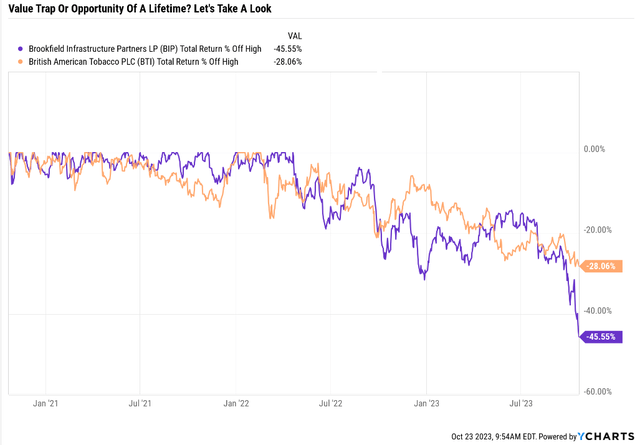
I’ve had several requests from members for an update about Brookfield Infrastructure (NYSE:BIP, NYSE:BIPC) and British American Tobacco p.l.c. (NYSE:BTI), both of which are high-conviction recommendations that have been smashed along with the rest of the “bond alternatives.”
Ycharts
Given that both of these were undervalued before they began their recent bear markets, this 28% to 46% plunge indicates something terribly wrong with the fundamentals…or the buying opportunity of a lifetime.
Let’s take a look to see whether 6.6% yielding Brookfield Infrastructure and 9.9% yielding British American are broken value traps to avoid or Buffett-style “fat pitches” that could make your retirement dreams come true.
But before I do, let me make something very clear.
The Craziest Period In Financial History Is Over
For over a decade, investors thought of high-yield blue chips as “bond alternatives,” and it’s not hard to understand why.
Bloomberg
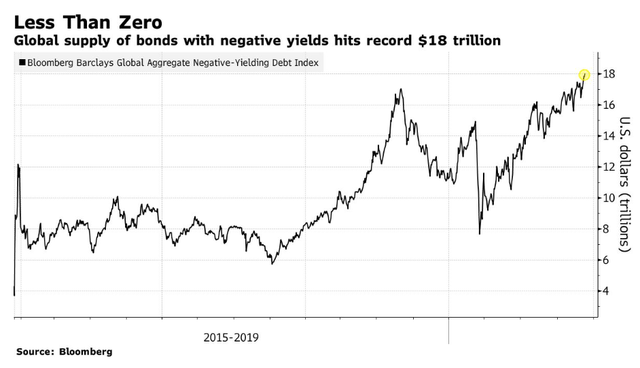
In 2020, the world saw a record $18 trillion in negative-yielding bonds. That’s not negative in inflation-adjusted terms, but literally, you’re guaranteed to get back less than you gave the government when the bond matures.
How crazy was this world?
Madness! Utter, Utter Madness!
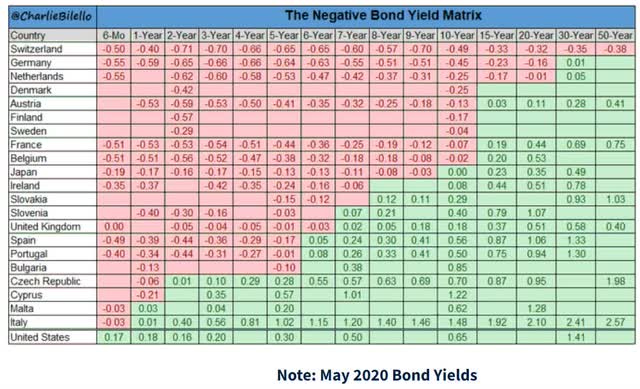
Charlie Bilello
Switzerland’s government could sell 50-year bonds at a -0.4% interest rate!
That means investors bought 50-year Swiss bonds, understanding they would get back 82 cents on the dollar…and that’s before inflation.
- adjusted for inflation a guaranteed 70% loss.
Why on earth would anyone agree to a guaranteed 70% loss on bonds? Because as crazy as buying a 50-year bond at a -0.4% yield was, some investors thought the yield might fall to -1%.
- a 30% capital gain on such a 50-year bond.
It’s the same reason that Austria could sell a 100-year bond at an interest rate of 2.1% or just 0.1% over 100 years, adjusting for the ECB’s 2% target inflation rate.
Why would someone lend to a government for 100 years expecting to earn just 11% after inflation? Because the yield fell to 1.66% during the Pandemic, and investors earned a quick 14% gain.
- duration is 32, the longest of any bond in the world
- pure, concentrated interest rate risk.
Today, that bond is down 55% of its Pandemic highs.
- 33 years to break from coupon payments
- not counting inflation (it will never break in real terms).
Some bonds are down even more, like the UK 30-year GILT that was auctioned at a yield of 0.62% in mid-2020 and is now down over 60%.
This is the world we lived in for over ten years. Money wasn’t just free; it had a negative price!
Even some corporations could borrow at negative rates, and Microsoft (MSFT) and Johnson & Johnson (JNJ) could lock in inflation-adjusted negative rates of about -1%.
How many negative-yielding bonds are left in the world? From $18 trillion in December of 2020 to zero today.
The era of getting paid to borrow money is over, and thank God, because negatively priced money created insane bubbles like this.
Madness, Utter, Utter Madness
Ycharts
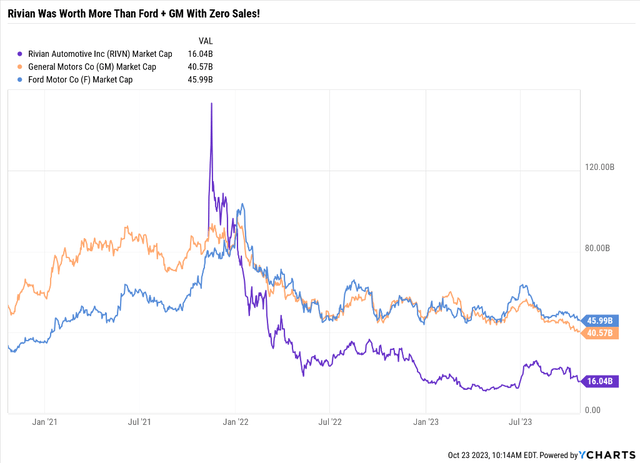
Rivian (RIVN) hit a peak of $150 billion market cap soon after its IPO, when it had zero sales and a forward sales forecast of $1.7 billion.
- worth more than Ford (F) and General Motors (GM) combined
- with a forward price/sales of 88.
That’s not a price-to-earnings ratio of 88; that’s price-to-sales. Rivian isn’t expected to earn a profit until 2029 at the earliest.
- If rates don’t come down, it will likely go bankrupt.
Okay, you can see the bubbles we created by the insanity of negative interest rates. let me show you why bond alternatives never existed, and anyone who thought they did potentially is in a lot of trouble.
Bond Alternatives Don’t Actually Exist
Bonds and stocks are nothing like other than they both generate income.
- a Ferrari and a Geo Metro both use gasoline, and both are cars
- they have about as much in common with each other as bonds and high-yield stocks do.
Ben Carlson
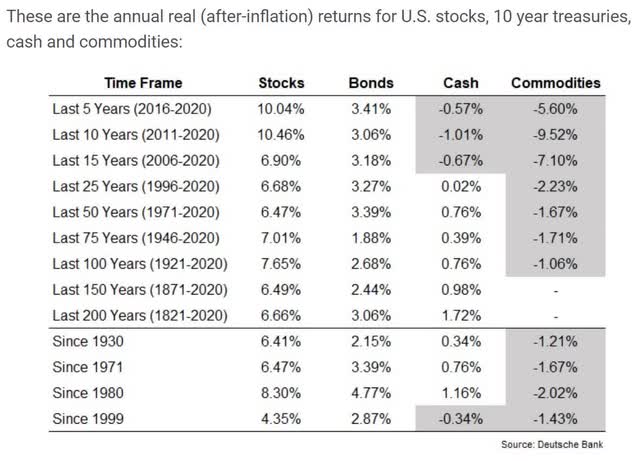
Cash has historically delivered 1.7% real returns after inflation, and today cash yields 2% in real terms.
Bonds deliver about 2X the real return of cash because there is duration risk.
And stocks historically achieve just over 2X the real return of bonds, and 4X that of cash.
Cash is basically risk-free, T-bills, or CDs, or high-yield savings accounts at an FDIC insured bank.
Outside of the apocalypse, you are going to get all your money back, even if the U.S. government has to print the money to give it you.
Bonds are a promise from a government or company to give you back your original investment after some period of time and pay you interest every 6 months while you wait.
In the event of default, bond investors get paid first, and stock investors? Well, they are lucky to get anything (stock goes to zero).
So why would anyone own stocks if they are “risk assets”? Because in exchange for the risk of losing all your money if the company goes bust, you have unlimited upside if corporate profits grow.
According to BlackRock, the U.S. stock market has delivered 7% inflation-adjusted returns since 1800.
- $1 invested in US T-bills in 1800 is $44.84 adjusted for inflation
- $1 invested in US treasury bonds is worth $803
- $1 invested in stocks is worth $3,569,295.
Okay, so you can see why everyone loves owning at least some stocks. But this is for the U.S. stock market in general.
Hartford Funds
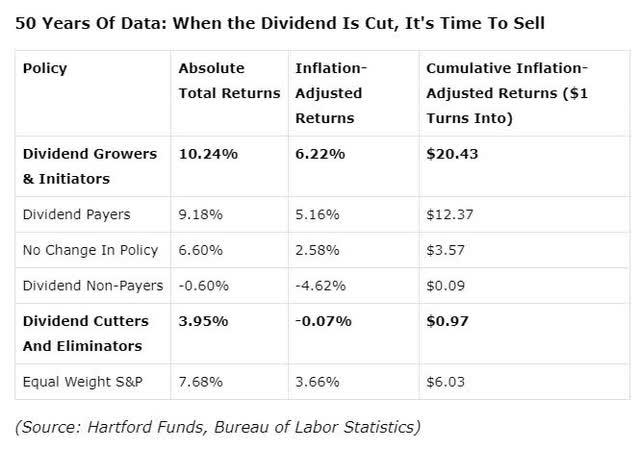
Dividend growth stocks historically outperform the market by about 2.5% per year over the long-term.
So what does that mean for those buying high-yield blue chips like Schwab U.S. Dividend Equity ETF™ (SCHD) compared to bonds and cash at today’s interest rates?
- SCHD: 10 Reasons You Want To Buy This Buffett-Style High-Yield ETF.
Over 200 years, dividend blue-chips, assuming they maintained the same historical returns as over the last 50 years (U.S. stock returns are extremely stable over various periods) would have turned $1 into a truly amazing fortune.
Inflation Adjusted Returns Since 1800
- $1 invested in US T-bills in 1800 is $44.84 adjusted for inflation
- $1 invested in US treasury bonds is worth $803
- $1 invested in stocks is worth $3,569,295
- $1 invested in dividend growth stocks is worth $615,670,828.
Can you see why I love dividend growth stocks so much? And I’m using them as the basis for my perpetual family charity hedge fund and foundation portfolio.
Ok, but what if you don’t have 223 years to wait to build up a vast fortune?
| Time Frame | Cash $1 invested becomes Inflation-Adjusted | Bonds $1 invested becomes Inflation-Adjusted | Stocks $1 invested becomes Inflation-Adjusted |
Dividend Stocks $1 invested becomes Inflation-Adjusted |
| 5 | $1.10 | $1.13 | $1.45 | $1.69 |
| 10 | $1.22 | $1.28 | $2.10 | $2.87 |
| 15 | $1.35 | $1.45 | $3.04 | $4.85 |
| 20 | $1.49 | $1.64 | $4.41 | $8.21 |
| 25 | $1.64 | $1.85 | $6.39 | $13.89 |
| 30 (retirement time frame) | $1.81 | $2.10 | $9.26 | $23.52 |
| 35 | $2.00 | $2.37 | $13.41 | $39.81 |
| 40 | $2.21 | $2.69 | $19.44 | $67.38 |
| 45 | $2.44 | $3.04 | $28.16 | $114.06 |
| 50 | $2.69 | $3.44 | $40.81 | $193.06 |
| 55 | $2.97 | $3.89 | $59.14 | $326.79 |
| 60 (investing lifetime starting at age 30) | $3.28 | $4.40 | $85.69 | $553.15 |
(Sources: FactSet, Bloomberg, Morningstar.)
Over an investing lifetime, cash can triple your money, assuming today’s 2% real yield holds.
Bonds will slightly more than quadruple your money, adjusted for inflation.
U.S. stocks are expected to deliver truly astonishing returns, but dividend stocks? Thanks to triple compounding, they could turn $2,000 invested today into more than $1 million in 60 years, adjusted for inflation.
Or, to put it another way, dividend stocks have 126X the real wealth compounding power of bonds over an investing lifetime.
- dividends grow exponentially over time
- dividends buy exponentially more shares over time
- you steadily buy more shares with your savings.
Now, can you see why it’s silly to call dividend stocks a bond alternative? Bonds are not about growth but capital preservation.
Dividend stocks are about income today and a lot more income in the future.
Do you know how much $1 invested in U.S. dividend stocks in 1800 would be paying in dividends today, according to BlackRock?
Adjusted for inflation, about $600,000 per $1 you invested 223 years ago.
Do you see the power of income growth compared to bonds, which are designed just to preserve purchasing power?
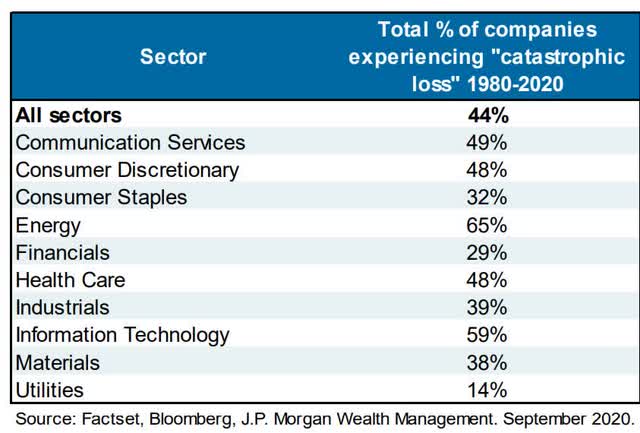
OK, but what about Brookfield and British American? Buying a 100-stock ETF that can’t go to zero outside of an apocalypse is one thing. But any individual stock can fail.
JPMorgan Asset Management
In fact, nearly half of all U.S. stocks do eventually fail, suffering permanent 70+% collapses.
So that’s why it’s worth looking under the hood of BIP and BTI to see whether these incredible ultra-yield blue-chips are a screaming buy or stocks you should run screaming away from.
Why British American Is Falling…Yet Again!
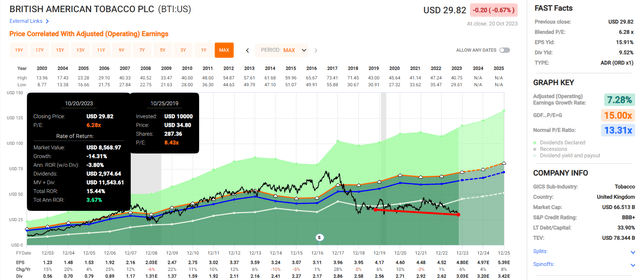
I understand the frustration of British-American investors who have done the right thing by all laws of God, Man, and Math.
FAST Graphs, FactSet Research Terminal
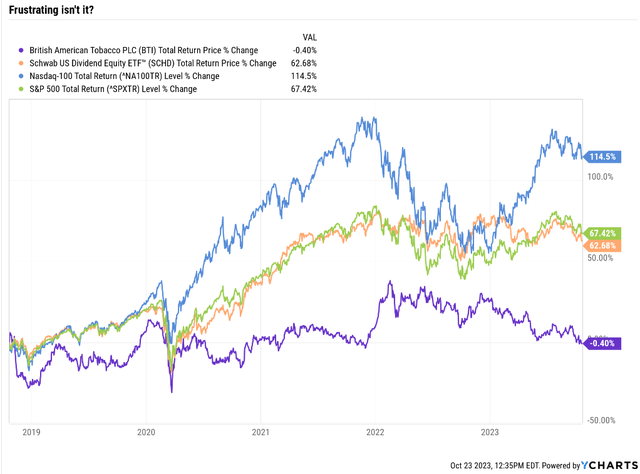
Since we first recommended BTI at a historical discount of about 50%, the stock price has decreased slightly, though with dividends, the return is +15%.
Ycharts
After five years of flat returns and down 24% adjusted for inflation.
But here is the thing to remember about BTI and why it’s not a value trap.
- Buy Like Buffett: British American’s 9.3% Yield Is The Highest In 23 Years.
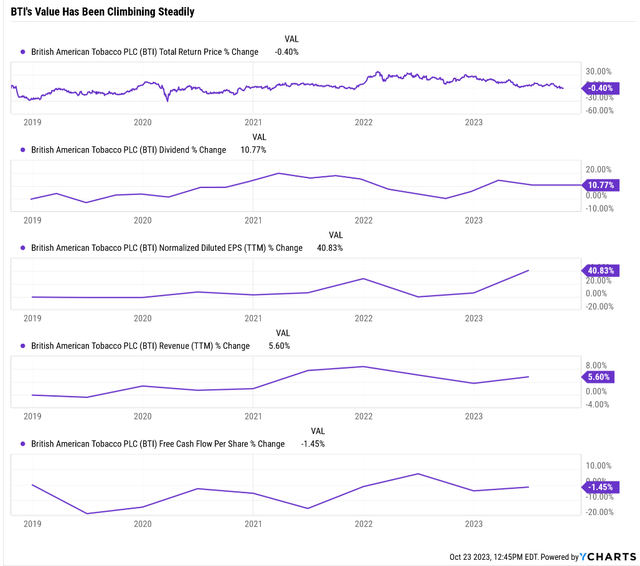
BTI’s yield is now 9.9%, and all the points I made, point by point, debunking the bearish arguments, remain valid.
Here is some more proof.
Ycharts
The Pound is down 6% in the last five years, so these numbers are 6% higher adjusted for constant currency.
- 17% growth in dividend
- 5% growth in free cash flow per share
- 12% growth in revenue
- 47% growth in EPS.
What is the probability that a company can grow all its fundamentals and still be down five years later?
| Time Frame (Years) |
Total Returns Explained By Fundamentals/Valuations |
| 1 Day | 0.02% |
| 1 month | 0.33% |
| 3 month | 1.0% |
| 6 months | 2.0% |
| 1 | 5% |
| 2 | 10% |
| 3 | 15% |
| 4 | 28% |
| 5 | 36% |
| 6 | 47% |
| 7 | 58% |
| 8 | 68% |
| 9 | 79% |
| 10+ | 90% |
| 20+ | 91% |
| 30+ | 97% |
(Source: JPMorgan, Fidelity, Princeton, RIA, Bank of America.)
There is actually a 64% chance that there is nothing wrong with BTI and that this is just bad luck.
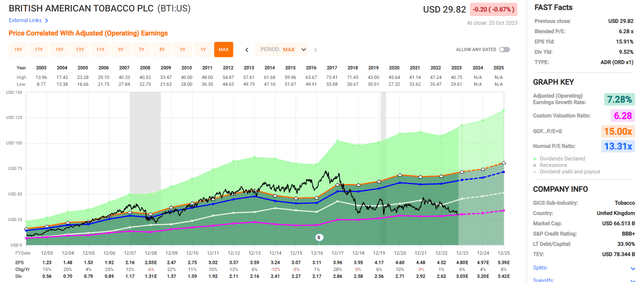
Earnings have almost doubled, and the price has gone down. That’s why the P/E is now the lowest in 25 years.
FAST Graphs, FactSet
Paying 6X earnings for a stock that has an objective 20-year market-determined fair value of 13.3?
OK, but maybe the growth outlook has collapsed? After all, didn’t the UK just announce some new anti-tobacco law?
- The UK Prime Minister proposes rules to create a smoking-free generation.
My goodness, that seems scary for tobacco investors.
UK Prime Minister Rishi Sunak proposed that the legal age for consuming cigarettes will be gradually raised to set a future ban on smoking effectively. Sunak said the changes in smoking laws would make it so that children turning 14 or younger this year can never legally be sold cigarettes in their lifetime. The UK government is also considering potential measures to restrict the availability of vaping products.
“We will not criminalize smoking – nor will anyone who can legally sell cigarettes today be prevented from doing so in the future. But we have a chance to cut cancer deaths by a quarter and significantly ease huge pressures on the NHS.” – Seeking Alpha
An effective bad on cigarettes? And potentially a ban on vaping? That’s it, BTI is doomed, which is why the price is down 10% in the last three months!
Except this is just a proposal from the Prime Minister. It might not pass. But what if it does?! Then BTI is doomed, right?! After all, it is called BRITISH American Tobacco! How much of its sales are from the UK?

FactSet Research Terminal
1% of BTI’s sales are at risk, a rounding error that will not affect its investment thesis or dividend safety.
What about the U.S.? Did the FDA announce it would ban nicotine in cigarettes? Nope.
What about the menthol bad? Nope.
BTI expects a menthol ban no sooner than 2027 and a reduction in nicotine to non-addictive levels around 2030.
And its reduced-risk vaping products are growing at between 35% to 50% per year, depending on the brand and product.

FactSet Research Terminal
BTI’s growth outlook remains unchanged at just under 5%, and management guidance at 7% to 9%.
When yielding 10%, even 4% to 5% growth means Nasdaq beats long-term returns.
Unless you think BTI will see its P/E continue to compress?
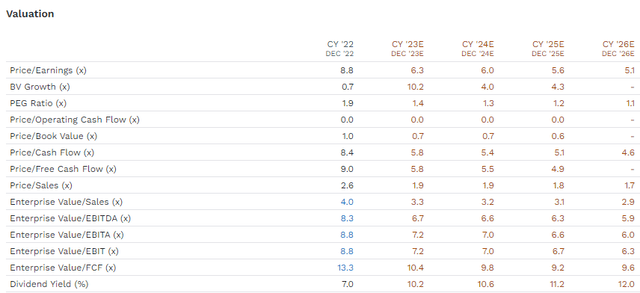
What if BTI’s Price Stays Flat Through 2026?
FactSet Research Terminal
Do you think BTI will be trading at 5X earnings in 2026 and a yield of 12%?
That is what the price staying flat for the next three years would mean if it grows as expected.
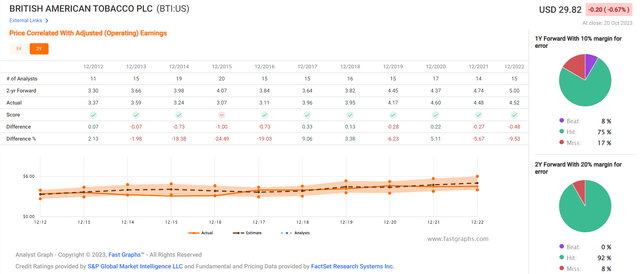
OK, but what if it doesn’t grow as expected?
FAST Graphs, FactSet
In recent years, BTI has only missed earnings expectations 8% of the time, and the biggest miss of the last five years was a 10% miss last year.
Okay, but what if something is dangerous with the dividend? Maybe that might cause a 10% yielding future dividend aristocrat (2025) to trade at 12% in a few years?

FactSet Research Terminal
No dividend cuts; instead 5.1% dividend growth, which makes sense. BTI’s payout ratio is 64%, and management targets a 65% payout ratio.
What about the free cash flow (“FCF”) payout ratio? Is BTI cooking the books? 58% next year, even lower, and 55% FCF payout ratio by 2026.
OK, but maybe the balance sheet is a mess?! Interest rates are soaring, after all. So maybe BTI is crashing due to balance sheet stress that puts the dividend at risk.
| Year | Total Debt (Millions) | Cash | Net Debt (Millions) | Interest Cost (Millions) | EBITDA (Millions) | Operating Cash Flow (Millions) |
| 2022 | $52,099 | $4,162 | $47,278 | $1,817 | $15,987 | $15,032 |
| 2023 | $51,543 | $4,839 | $45,565 | $2,379 | $17,204 | $16,111 |
| 2024 | $49,714 | $7,172 | $42,508 | $2,199 | $17,649 | $16,481 |
| 2025 | $48,495 | $8,993 | $38,841 | $1,904 | $18,402 | $17,284 |
| 2026 | NA | NA | $31,654 | NA | $19,540 | $18,456 |
| Annualized Growth | -2.36% | 29.28% | -6.34% | 1.57% | 4.80% | 4.76% |
(Source: FactSet Research Terminal.)
Net debt is falling at 6% per year. And interest costs are rising at less than 2% per year.
Meanwhile, the company’s cash flow and operating income is growing at around 5%, just like analysts expect long-term.
| Year | Debt/EBITDA | Net Debt/EBITDA (3 Or Less Safe According To Credit Rating Agencies) |
Interest Coverage (8+ Safe) |
| 2022 | 3.26 | 2.96 | 8.27 |
| 2023 | 3.00 | 2.65 | 6.77 |
| 2024 | 2.82 | 2.41 | 7.49 |
| 2025 | 2.64 | 2.11 | 9.08 |
| 2026 | NA | 1.62 | NA |
| Annualized Change | -6.83% | -10.63% | 3.14% |
(Source: FactSet Research Terminal.)
BTI’s leverage is already safe according to S&P and is expected to reach a low level by 2026 S&P will upgrade it to an A-rating (at a sustained leverage ratio of 2.5).
The interest coverage is a tad low this year, but by 2025, it should be safe, and that’s when I expect BTI to become an A-rated company.
OK, but what if the experts are wrong? What if S&P is wrong, and the analysts are all smoking weed, stoned, and making up numbers?
There is one group we can trust to be stone-cold sober, and brook no bullshit.
The bond market!
FactSet Research Terminal
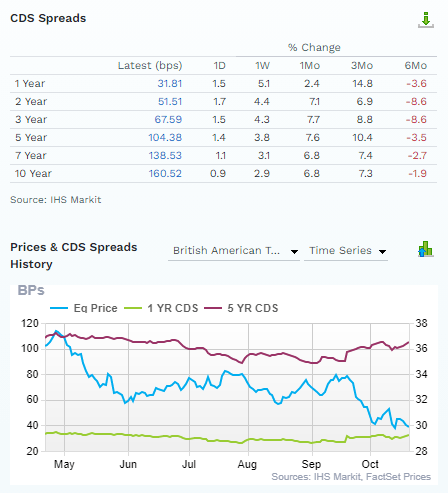
In the last three months, the bond market estimates that BTI’s fundamental risk of going bankrupt within five years went up 10.4%. Aha! That’s it. The price is down 10%, and the five-year fundamental risk is up 10%!
That explains it!
Not unless you think the stock price is down because the risk of default is up to 1.0438% over five years or 1.6052% over ten years or about 4.8% over 30 years, which is, by the way, what S&P estimates (5% = BBB+ rating).
So no, BTI’s 10% decline in the last three months isn’t due to:
- catastrophic regulatory risk
- a decline in the growth outlook
- increased fundamental balance sheet risk
- any negative statements from analysts or rating agencies.
There is no reason for BTI to fall other than…it’s been in a bull market for six years, and unpopular stocks often fall in a correction.
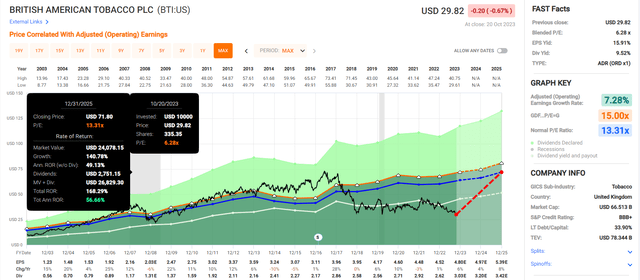
Take A Look At This Coiled Spring!
FAST Graphs, FactSet
It seems impossible right now, six years into a bear market. But BTI will one day return to fair value and even become overvalued now.
Here me now, quote me later;)
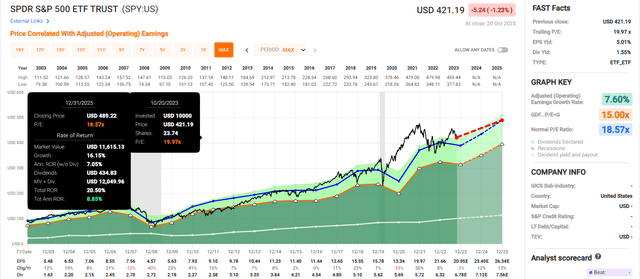
It seems impossible to believe right now, but BTI will likely beat the S&P in the coming two years.
FAST Graphs, FactSet
The only way that BTI underperforms the market in the next two years is if fundamentals collapse, or the S&P flies off into a tech-style speculative mania, or BTI trades flat while growing its fundamentals.
And then I’ll be pounding the table even harder about this 11% and 12% yielding dividend aristocrat trading at 5X earnings;)
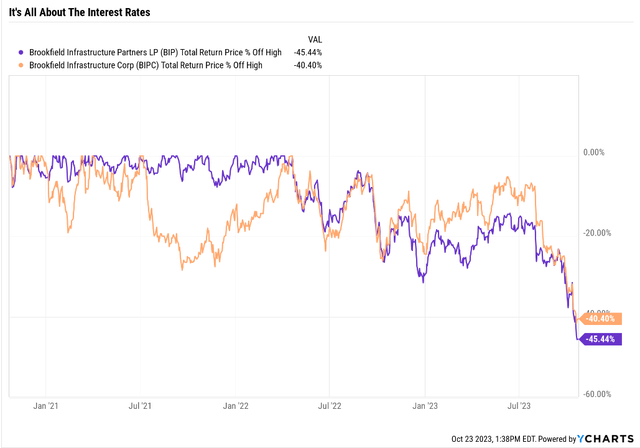
Why Brookfield Infrastructure Is Getting Crushed
Ycharts
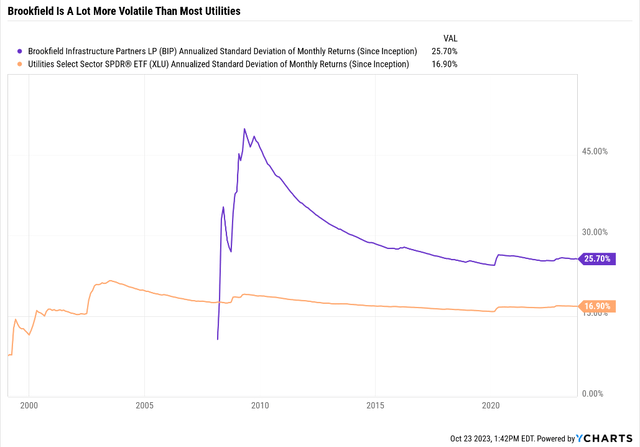
That’s a lot worse than most utilities, and I’ll explain why Brookfield is going off a cliff in a moment.
Ycharts
BIP has always been more volatile than most utilities and that’s because it’s structured as a hedge fund.
- BIP is a fund Brookfield Asset Management runs
- it invests in hard assets and infrastructure around the world
- it pays BAM management fees plus incentive distribution rights
- it’s structured as an LP whose assets are all individual LPs
- making for one of the most complex K1 tax forms I’ve ever seen
- BIPC has no K1 (that’s why it’s always trading at a premium)
- it uses non-recourse self-amortizing project-level debt (commercial mortgages for each asset).
Most likely, BIP has fallen off a cliff because the market is worried about interest rates.
BIP’s debt looks high if you don’t realize that it is designed to have high but safe debt.
- each project is its own mortgage
- if BIP defaults on a project it “hands over the keys” and isn’t liable for the rest
- This is how BAM has been growing at 20% annually for 40 years
- and they have yet to get in trouble with their commercial mortgages.
OK, but maybe high rates mean that BIP can’t afford to grow as fast as initially thought?
BIP September Investor Day
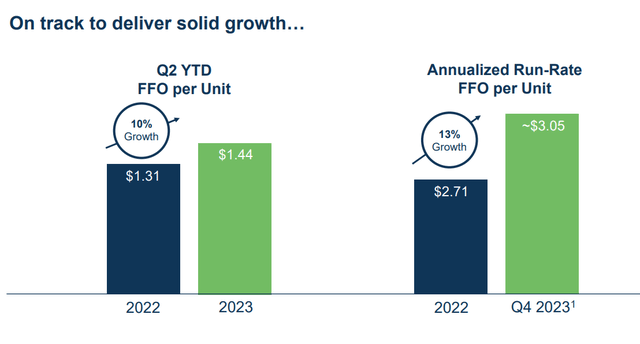
BIP is closing on three major deals this year, and management is guiding for 13% growth in FFO/share.
Okay, but what about the long-term growth outlook? What do the next 5 years look like? According to analysts? 12% annual growth in AFFO.

FactSet Research Terminal
With no distribution cuts and no dangerous payout ratios, BIP is full speed ahead on its growth plans.
BIP September Investor Day
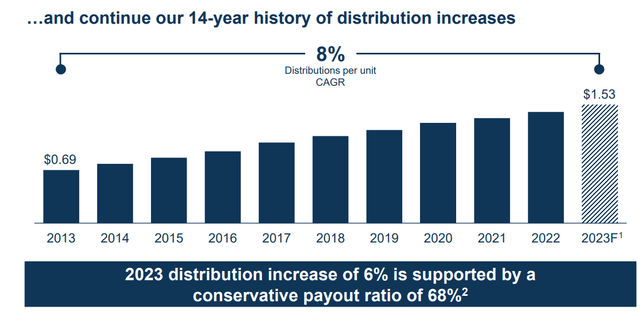
Management is guiding for 5% to 9% annual dividend growth, and it delivered a 6% hike this year. The payout ratio is 68% compared to 75% for utilities or 90% for yieldCos (which it technically is).
BIP September Investor Day
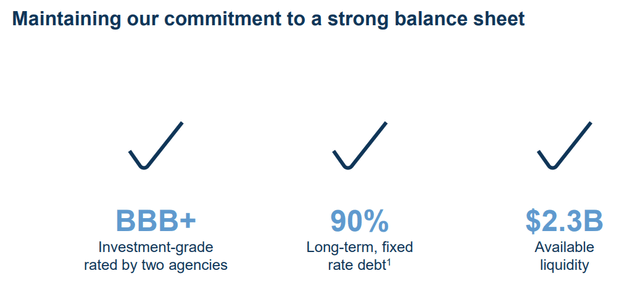
The debt is 90% fixed and BIP has $2.3 billion in available liquidity to keep buying assets.
But won’t rising rates eventually hurt its growth prospects?
BIP September Investor Day
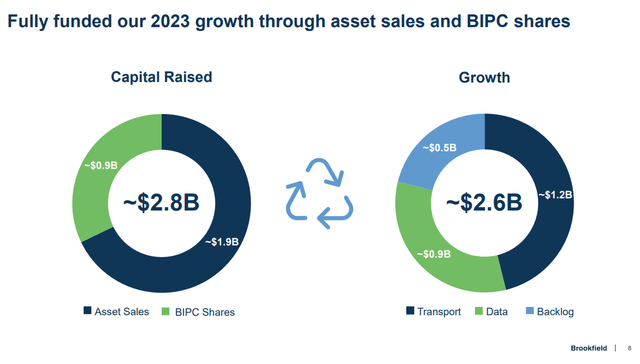
BIP sold about $1 billion worth of stock earlier this year, representing about 10% dilution.
That doesn’t explain a 26% collapse, which is mostly driven by interest rate.
Ok, but won’t its long-term growth plans run into trouble if rates stay high forever and the stock price doesn’t recover?
BIP September Investor Day
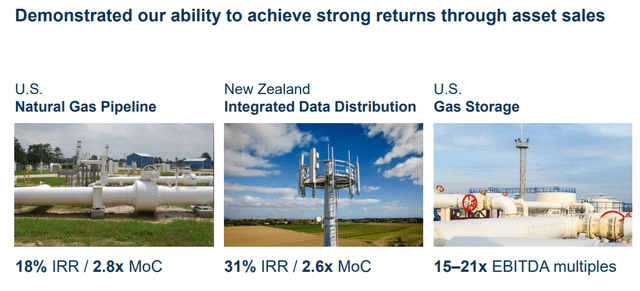
BIP can sell assets at very nice prices, even in this ratepocalypse.
It’s earning 18% to 31% annualized returns on asset sales and recycling the capital into better opportunities.
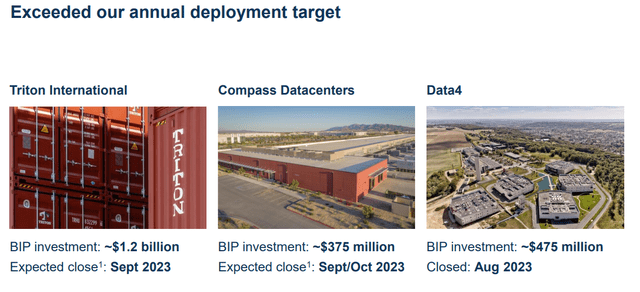
BIP September Investor Day
Opportunities like Triton International, the world’s largest container leasing company.
Or more data centers because you can never have enough data centers when data will rule the world.
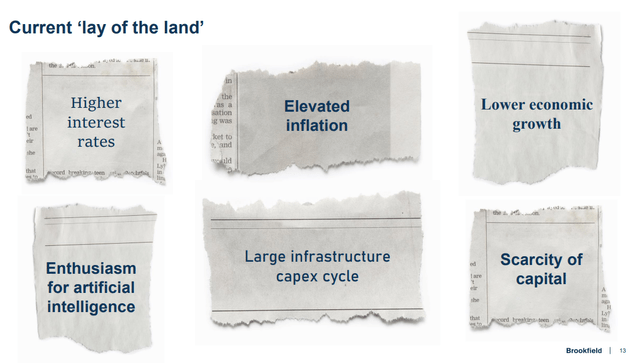
Why Brookfield Isn’t Worried About Its Growth Plans, And Neither Am I
BIP September Investor Day
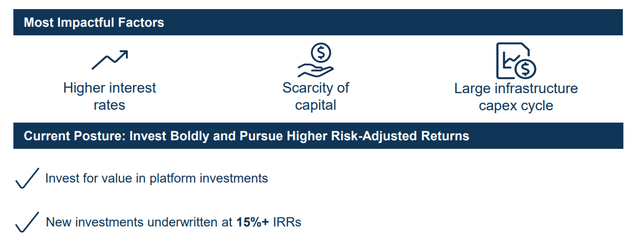
BIP has plenty of access to capital. What about the rising rates? Investment valuations are coming down.
Remember how REITs were able to grow in the 1970s with 20% interest rates?
That’s because if the cash yield on a property is 23%, then interest rates of 20% still leave a 3% investment spread.
It’s no different than if a REIT borrowed at 1% and bought properties with a 4% cash yield, the growth rate is the same.
If BIP’s borrowing costs rise 1% and it can pay about 15% less for an asset then its investment spread remains intact.
BIP September Investor Day
BIP September Investor Day
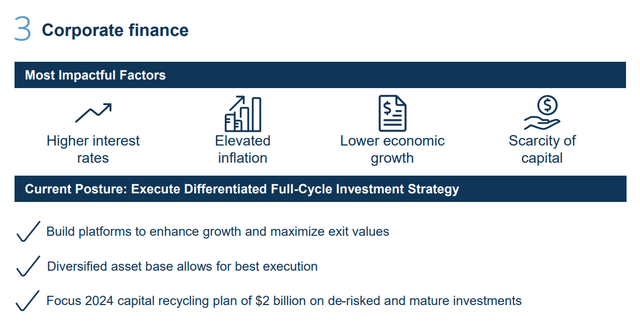
BIP plans to sell $2 billion in assets next year; remember, it’s a master operator.
It buys a project cheaply or builds it from scratch. Then, it improves it and sells it at a profit.
The game plan is the same whether rates are 3% or 6%.
BIP September Investor Day
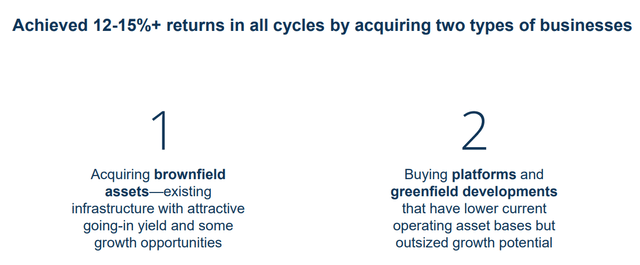
How can BIP keep investing in incredible opportunities if rates are so high? Because it has tens of billions in callable capital.
That’s when a big institute like a pension fund signs a contract with Brookfield to invest with it.
If Brookfield calls them and asks for the money, they are legally obligated to hand it over for investment.
BIP September Investor Day
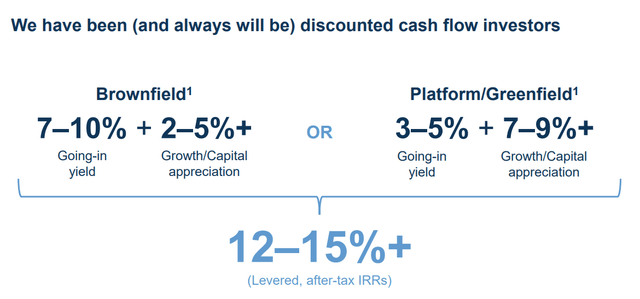
This is how Brookfield has operated for 40 years, delivering 20% annual returns for investors.
BIP September Investor Day
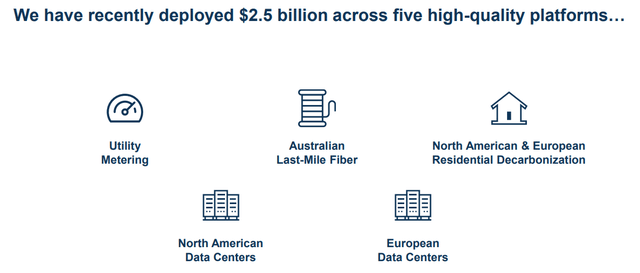
BIP has invested $2.5 billion in the last year, during the fastest increase in interest rates in over 20 years.
BIP September Investor Day
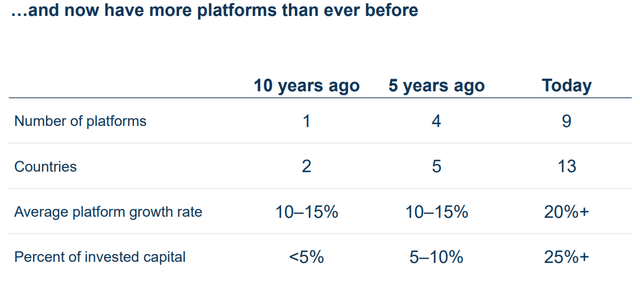
It is steadily diversifying its infrastructure platforms, adding data centers, fiber optics, and telecom towers.
Management points out that those new platforms, the ones growing at 20+%, are currently 25% of new invested capital as we advance but just 5% of EBITDA, meaning there is a lot of growth baked into this business in the future.
BIP September Investor Day
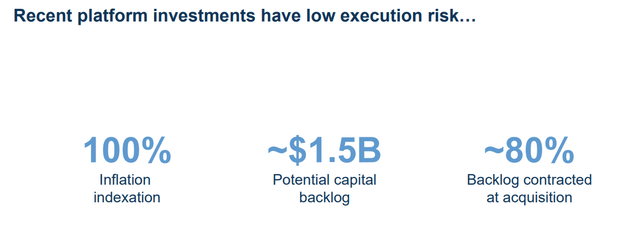
The new assets BIP is now buying are 100% indexed to inflation and 80% contracted revenue, and it has $1.5 billion in deal backlog its working on now.
So, as of September, BIP is not struggling for opportunity or capital. Sure, it was easier when money cost negative rates. Still, Brookfield was founded in 1902 and has survived, adapted, and thrived through the Depression, two world wars, a global pandemic that killed 5% of humanity, and 20% interest rates, among many other terrible things.
BIP September Investor Day
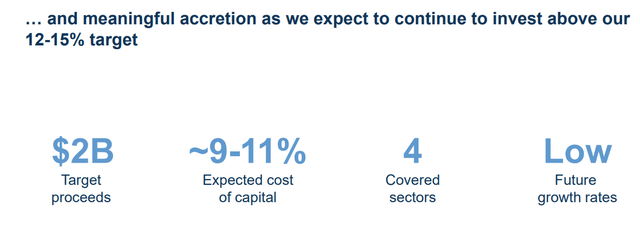
Management is planning for a 10% cost of capital and still thinks it can achieve 12% to 15% annual returns.
BIP September Investor Day
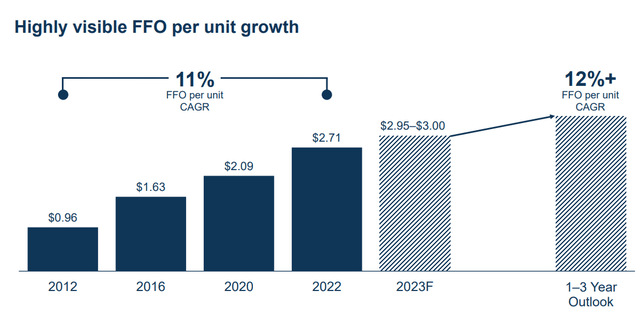
BIP has been growing at 11% for the last decade, and management thinks it can keep growing at similar rates. The median analyst consensus from 11 analysts? 12%.
BIP September Investor Day
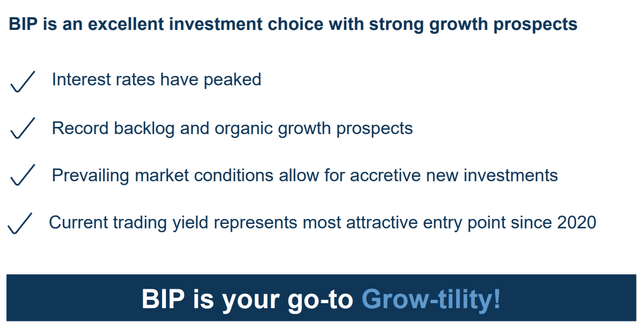
So basically management affirms its previous guidance, and says it has successfully adapted to a world of 5% interest rates.
What About The BIP Short Report?
A recent short report has been circulating, and some members have asked me to address it.
The basics of this report are claims that BIP has been run effectively as an unsustainable Ponzi scheme since the beginning.
Net Asset Value supposedly has been inflated (by about 100%), and in a low-rate world, this kind of unsustainable share printing yieldCo was possible, but in a higher-rate world, the entire scheme falls apart.
The dividend/distribution isn’t sustainable and is thus unsafe.
You can read the report yourself, but here is why I am not losing sleep over BIP.
Why I Trust Brookfield And Believe You Can, Too
I’ve seen this kind of claim before, especially for utilities and REITs.
“Look at how debt and share count rises over time; it’s unsustainable.”
Utilities, REITs, Midstreams, and YieldCos pay out of earnings, AFFO, DCF, and AFFO respectively.
“Those are made up of non-GAAP numbers! They are a lie!”
Ycharts
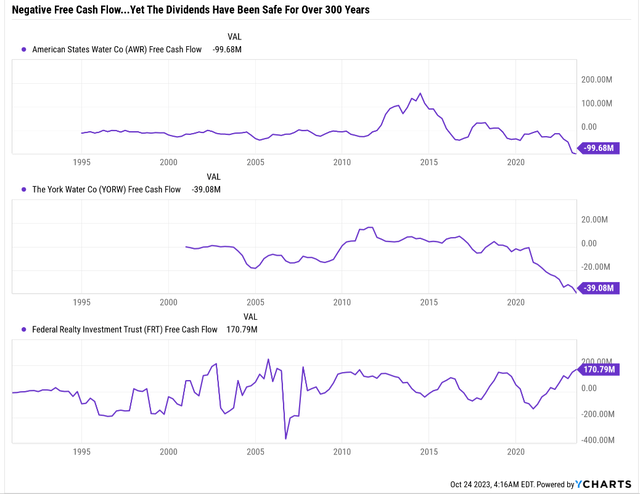
Yes, its true most utilities have negative free cash flow, and usually, REITs do too.
They constantly invest in growth projects funded through retained earnings/cash flow, debt, and new equity issuances.
Ycharts
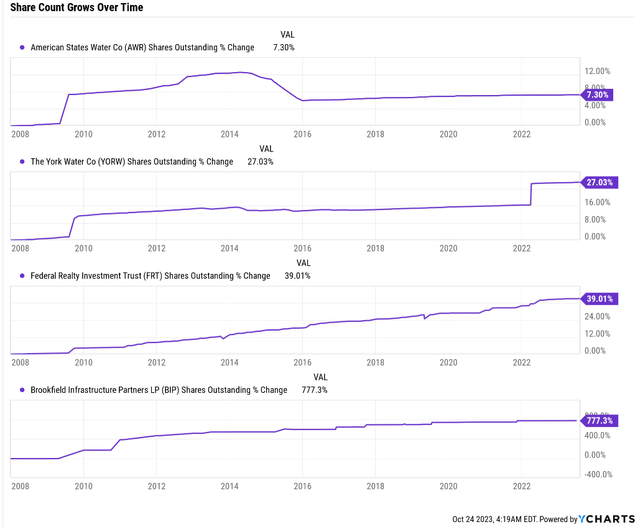
BIP’s share issuance are more aggressive than most utilities true, but then again, few utilities grow at 11% FFO/share.
Why am I highlighting American States Water, York Water Company, and Federal Realty (FRT)?
- American States Water’s 68-year dividend growth streak tied for the longest streak on earth (with NWN, another utility)
- Federal Realty’s 56-year dividend streak
- York Water 213 years without a dividend cut (longest streak on earth).
You could argue that if the debt and equity markets ever shut out these utilities and REITs, they couldn’t operate as they do today.
But if something continues for decades, it’s 97% likely to be sustainable.

BIP September Investor Day
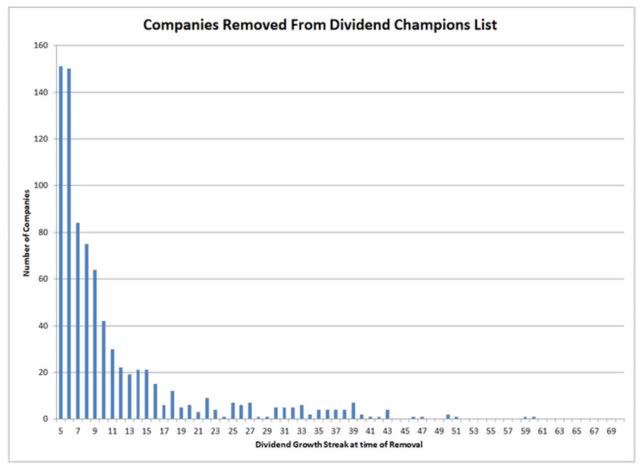
BIP is up to a 14-year dividend growth streak, which is now statistically significant, based on the risk of dividend cuts during the Pandemic.
Pandemic Dividend Cuts By Dividend Streak
Justin Law
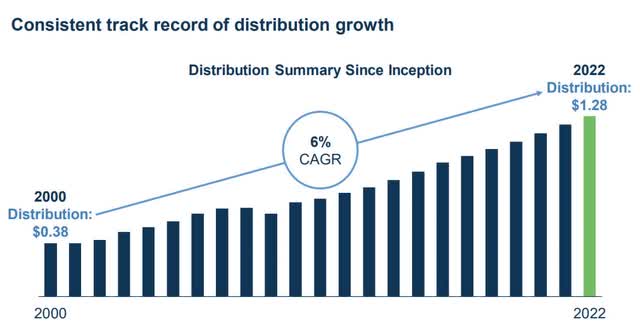
Brookfield
This is Brookfield Renewable’s dividend streak, and BEPC and BEP are also yieldCos run on the same model as BIP and BIPC.
- BEP has never cut its dividend adjusted for the recent spin-off of BIPC shares
- and the switch from quarterly to monthly payer and back to quarterly.
I’m saying I trust Brookfield because this is a business that has delivered
Proof Is In The Pudding
Rolling Returns Since 2009

Portfolio Visualizer
For 14 years, BIP, BEP, and Brookfield have delivered exceptional returns, even in a raging bull market where tech was unbeatable.
Rolling Returns Since 2003

Portfolio Visualizer
For 20 years, Brookfield has been delivering average annual returns of 19%, and including bear markets like this one it and BEP have crushed the market.
What is the probability of an unsustainable scam going on for 20 years? Statistically, about 9%.
What about BIP’s 14-year track record of excellent returns? That’s a 10% statistical chance of being a scam.
Some Additional Proof To Back Up My Trust In Brookfield
OK, so Brookfield says that BIP’s thesis is intact, 12% growth for the foreseeable future and of course, infrastructure is a massive growth market for decades to come.
We have a short thesis that claims management is inflating asset value and this is all unsustainable even though BEP has been running on the same model with interest rates as high as 7% and it’s been crushing the market with no dividend cuts for almost a quarter century.
Brookfield says it sees a clear path to 20% returns in the future (about 17% to 16% for BEPC and BIPC) for the next 20 years.
Analysts expect 12% growth from BIP in the coming years.
So, how trustworthy are management guidance and analyst growth estimates based on that guidance?
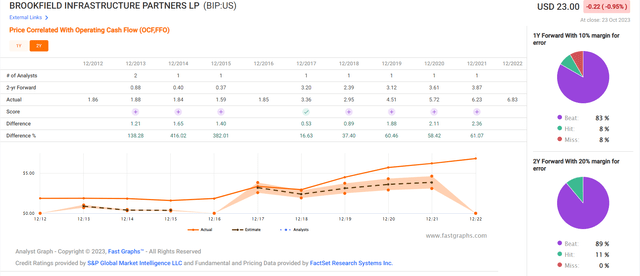
FAST Graphs, FactSet
In the last decade, BIP has beaten expectations 83% to 89% of the time.
When management says it will grow at a specific rate, it does.
OK, but doesn’t that potentially mean it might be a scam? Didn’t General Electric (GE) not miss earnings for a decade through creative accounting?
Sure, so let’s check some more fundamentals.

FAST Graphs, FactSet
In 2022 BIP’s various payout ratios from data filed with the SEC, if BIP is lying it’s accounting fraud.
- Free cash flow payout ratio: 80%
- DCF payout ratio: 65% (target range 65% to 75%)
- AFFO payout ratio: 65%
- FFO Payout ratio: 53%.
Do we have any forecasts for dividend cuts? No.
How about a payout ratio over 100% on any cash flow metric? No.
So we have a short claiming fraud and 10 analysts, management and rating agencies saying the Brookfield is trustworthy.
Let’s Think About This Logically
Brookfield has almost $900 billion in assets under management.
According to Brookfield, let’s consider BIP and BEP, which have $59 billion and $66 billion in AUM, respectively.
The short report uses other funds valuation methodology to estimate that Brookfield values these assets at 104% their actual value.
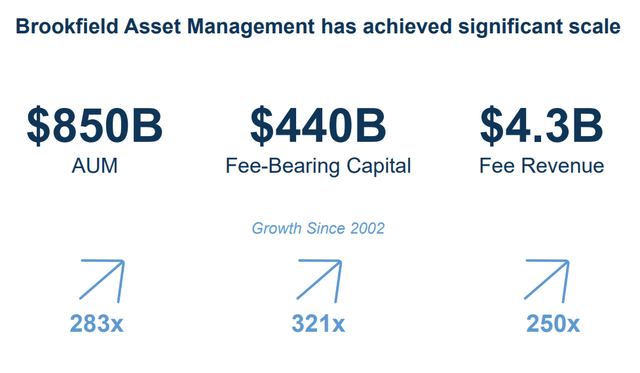
Brookfield
13% of BAM’s assets are in BIP and BEP.
What is the chance that Brookfield runs a Ponzi-like scam in a business run entirely on trust?
Would Brookfield put the entire empire at risk to try to earn some fat fees from BIP and BEP investors?
And eventually, when those Ponzi schemes collapse, the credibility of the entire company is wiped out.
Again, this business model has been run at BEP for 23 years and during periods of interest rates as high as 7%.
- S&P credit rating BBB+ stable
- Fitch credit rating BBB+ stable.
S&P and Fitch consider Brookfield Infrastructure a reputable and sustainable business with a 5% risk of defaulting in the next 30 years.
Long-Term Risk Management Analysis: How Large Institutions Measure Total Risk Management
DK uses S&P Global’s global long-term risk-management ratings for our risk rating.
- S&P has spent over 20 years perfecting its risk model
- which is based on over 30 major risk categories, over 130 subcategories, and 1,000 individual metrics
- 50% of metrics are industry-specific
- this risk rating has been included in every credit rating for decades.
The DK risk rating is based on the global percentile of a company’s risk management compared to 8,000 S&P-rated companies covering 90% of the world’s market cap.
Brookfield Scores 77th Percentile On Global Long-Term Risk Management
S&P’s risk management scores factor in things like:
- supply chain management
- crisis management
- cyber-security
- privacy protection
- efficiency
- R&D efficiency
- innovation management
- labor relations
- talent retention
- worker training/skills improvement
- occupational health & safety
- customer relationship management
- business ethics
- climate strategy adaptation
- sustainable agricultural practices
- corporate governance
- brand management.
| Classification | S&P LT Risk-Management Global Percentile |
Risk-Management Interpretation |
Risk-Management Rating |
| BTI, ILMN, SIEGY, SPGI, WM, CI, CSCO, WMB, SAP, CL | 100 | Exceptional (Top 80 companies in the world) | Very Low Risk |
| Strong ESG Stocks | 86 |
Very Good |
Very Low Risk |
| Brookfield (BAM, BIP, and BEP) | 77 |
Good, Bordering On Very Good |
Low Risk |
| Foreign Dividend Stocks | 77 |
Good, Bordering On Very Good |
Low Risk |
| Ultra SWANs | 74 | Good | Low Risk |
| Dividend Aristocrats | 67 | Above-Average (Bordering On Good) | Low Risk |
| Low Volatility Stocks | 65 | Above-Average | Low Risk |
| Master List average | 61 | Above-Average | Low Risk |
| Dividend Kings | 60 | Above-Average | Low Risk |
| Hyper-Growth stocks | 59 | Average, Bordering On Above-Average | Medium Risk |
| Dividend Champions | 55 | Average | Medium Risk |
| Monthly Dividend Stocks | 41 | Average | Medium Risk |
(Source: DK Research Terminal.)
How We Monitor BIP’s Risk Profile
- 10 analysts,
- two credit rating agencies
- 12 experts who collectively know this business better than anyone other than management.
When the facts change, I change my mind. What do you do, sir?” – John Maynard Keynes
There are no sacred cows here. Wherever the fundamentals lead, we always follow. That’s the essence of disciplined financial science, the math behind retiring rich and staying rich in retirement.
Bottom Line: British American & Brookfield Are Screaming Buys
British American and Brookfield Infrastructure are two excellent long-term high-yield investments.
After reviewing the data, I can confirm that their investment thesis remain intact.
I can’t tell how much of Brookfield’s bear market is due to the short report, which naturally is coming during a bear market when sentiment is most dour.
I’m not a forensic accountant, but when all the SEC data, consensus data, rating agencies, and a management team that has delivered Buffett-like returns for 20 years say the claims are false, I believe it.
- there is a statistically 9% to 10% chance that Brookfield is committing fraud
- and a 90% chance that this short report is accusing Warren Buffett of hedge funds of fraud.
Since a picture is worth a thousand words, let me conclude with two pictures that tell you everything you need to know about BTI and BIP.
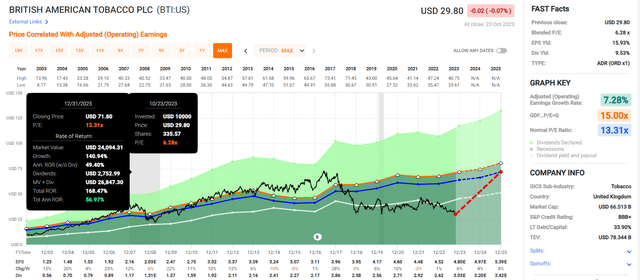
FAST Graphs, FactSet
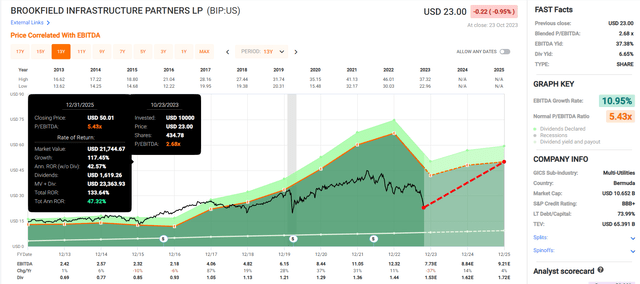
FAST Graphs, FactSet
Read the full article here





Leave a Reply