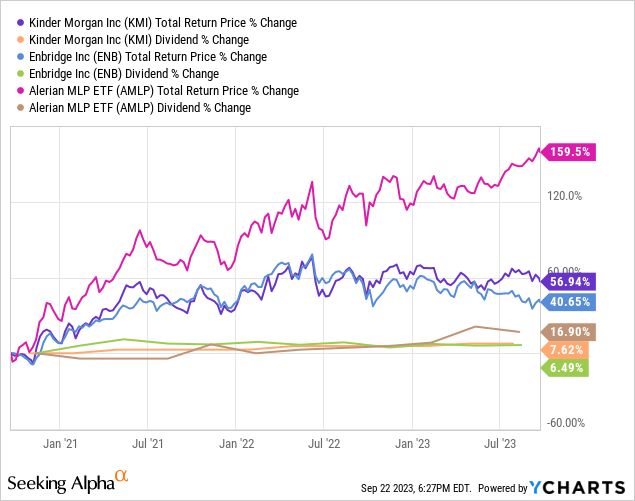
Enbridge (NYSE:ENB) and Kinder Morgan (NYSE:KMI) have both generated consistent, albeit slow, dividend growth, over the past three years with mediocre total return performance alongside it that has significantly lagged that of the broader midstream sector (AMLP) over that period of time:
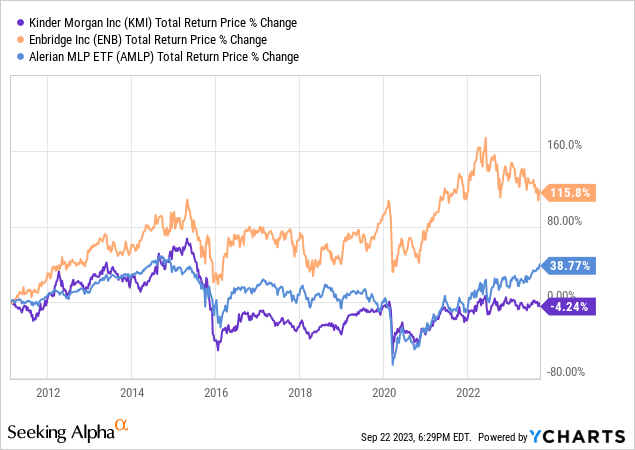
That being said, thanks in large part to a disastrous dividend cut a number of years ago, KMI has dramatically underperformed ENB and even AMLP over the long-term:
In this article, we compare ENB and KMI side by side and offer our take on which one is a better buy right now.
ENB Stock Vs. KMI Stock: Business Model
ENB’s boasts large midstream infrastructure business is well-diversified across numerous segments of the midstream space, including liquid pipelines, gas transmission and distribution, and a growing renewable power generation portfolio. ENB also recently made a $14 billion acquisition of several natural gas utilities businesses from Dominion Energy (D), making it North America’s largest natural gas utility company.
In addition to having North America’s largest natural gas utility, it owns one of the longest natural gas transmission pipeline networks in the United States, the largest natural gas distribution business in North America, and the longest crude oil pipeline network.
As a result of its emphasis on utilities, the majority of its pro-forma EBITDA after the closing of the Dominion Energy deal will come from regulated assets and virtually all of its remaining EBITDA will come from long-term take-or-pay contracts and nearly all of its counterparties are investment grade. As a result, it enjoys exceptional stability of cash flows, regardless of the macroeconomic and energy industry conditions are at any given time. As a result, it boasts a very impressive 28-year dividend growth streak, making it arguably the industry’s most reliable dividend growth stock.
While KMI is not as large as ENB and does not have nearly the same dividend growth track record, it still owns very high-quality assets. It is primarily a major natural gas infrastructure player, with 62% of its EBITDA coming from assets that serve that segment. It benefits from economies of scale and strategically located assets that make it an indispensable player in the North American energy industry, including North America’s largest CO2 transport capacity with ~1,500 miles of CO2 pipelines, largest independent terminal operations with 140 terminals and 16 Jones Act vessels, largest natural gas transmission network with ~70,000 miles of pipelines that provides ~15% of U.S. natural gas storage and transports ~40% of the United States’ natural gas production, and largest independent refined products transportation network with ~10,000 miles of refined products and crude pipelines. Furthermore, it is investing in growing its energy transition business, with a particularly strong focus on RNG production capacity.
Like ENB, it has a very stable cash flow profile with 93% of its EBITDA stemming from long-term commodity price resistant contracts. While it does not have the regulated utility exposure that ENB enjoys, it still has ample cash flow stability in the face of wild swings in energy prices and shifting macroeconomic conditions.
ENB Stock Vs. KMI Stock: Balance Sheet
ENB has one of the highest credit ratings in the midstream segment with a BBB+ rating from S&P. It can command this higher credit rating despite having much higher leverage on its balance sheet than many of its lower rated peers do because of its extremely high-quality cash flow profile with substantial utility exposure, little to no commodity price exposure, and counterparties that are almost all investment grade. One of the beauties of ENB’s balance sheet is that it has a large amount of its debt at fixed interest rates and not maturing for many decades (including well into the second half of the 21st century). This gives it a pretty predictable cost of debt for many years to come, further enhancing its distributable cash flow stability.
KMI, meanwhile, comes in just a tiny bit behind ENB with its BBB credit rating and has a fairly low leverage ratio of 4.1x with expectations of finishing this year with a 4.0x net debt to adjusted EBITDA ratio. Given that their long-term target is 4.5x, they have substantial flexibility to buy back stock and invest in growth projects opportunistically.
Both businesses generate a lot of cash flow above and beyond their dividends, enabling them to fund much – if not all – of their growth capex with retained cash flow and lean only on debt markets when debt comes due for refinancing or when making a large acquisition.
ENB Stock Vs. KMI Stock: Dividend Outlook
ENB’s dividend growth rate is expected to come in between 3-5% annually for the foreseeable future. Prior to the announcement of the Dominion Energy acquisition, analysts forecast a 3.1% CAGR for ENB’s dividend through 2027. That said, ENB’s CEO thinks that its acquisition of the Dominion utilities would further enhance ENB’s ability to grow its dividend over time in addition to enhancing its earnings quality. Overall, we think that ENB will likely grow its dividend at a 3-4% CAGR for years to come.
KMI, meanwhile, has opted for a slow dividend growth rate as it has been focused on deleveraging, investing in an impressive array of new projects, and buying back stock when opportunistic to do so. This should improve somewhat moving forward, as growth CapEx should decline a little bit and the company’s leverage has reached a very satisfactory level. That said, analysts don’t think it will grow much more than at a 3% CAGR through 2027, and thus far KMI has not given investors any reason to think it will grow faster than that.
ENB Stock Vs. KMI Stock: Valuation
KMI is clearly cheaper than ENB on both an EV/EBITDA and P/DCF basis. KMI’s current EV/EBITDA stands at an 11.2% discount to its five-year average EV/EBITDA while ENB’s current EV/EBITDA stands at a 6.5% discount to its five-year average EV/EBITDA.
That said, ENB does offer an 80-basis point higher dividend yield than KMI does, so income investors may prefer the higher yield even if it comes at a more costly valuation for the underlying cash flows.
| Metric | ENB | KMI |
| EV/EBITDA | 11.66x | 8.93x |
| EV/EBITDA (5-Yr Avg) | 12.47x | 10.06x |
| P/2023E DCF | 8.59x | 7.87x |
| NTM Dividend Yield | 7.7% | 6.9% |
Investor Takeaway
Both ENB and KMI are high quality infrastructure businesses that have strong counterparties, very low short-term commodity price cash flow exposure, rock solid investment grade balance sheets, a clear path to growing their dividends for years to come, attractive current dividend yields, and discounted valuations relative to their historical averages.
That said, ENB’s cash flow profile is undoubtedly higher quality given its greater exposure to regulated earnings and investment grade counterparties and its current dividend yield plus growth profile plus dividend growth track record make it appear to be a superior dividend stock. On the other hand, KMI’s balance sheet is arguably better than ENB’s despite its lower credit rating given that its leverage ratio is quite a bit lower than ENB’s. Moreover, its valuation is quite a bit cheaper than ENB’s and it is retaining significantly more cash flow which it is using to buy back stock and invest in attractive growth projects.
ENB is also a 1099 issuing Canadian company (with related tax circumstances) that declares its dividends in Canadian Dollars whereas KMI is a 1099 issuing American company (with related tax circumstances) that declares its dividends in U.S. Dollars, so investors should keep that in mind before investing.
We like both and rate both as very attractive, low risk Buys right now and think that dividend focused investors who don’t mind owning a Canadian stock would probably like ENB more, whereas value investors and/or investors who prefer owning an American company would probably like KMI more.
Editor’s Note: This article discusses one or more securities that do not trade on a major U.S. exchange. Please be aware of the risks associated with these stocks.
Read the full article here









Leave a Reply