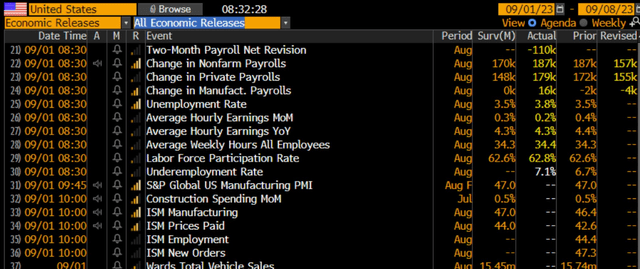
Nonfarm payrolls rose by 187,000 in August, slightly better than the +170,000 expectation, but the prior two months featured downward revisions of 110,000 positions. Manufacturing jobs surprisingly rose by 16,000.
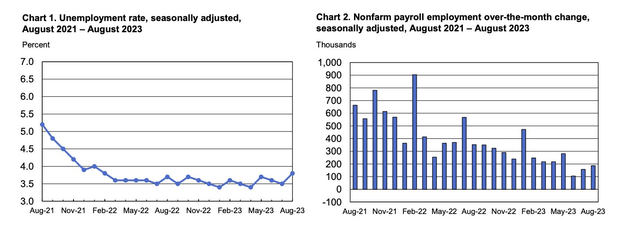
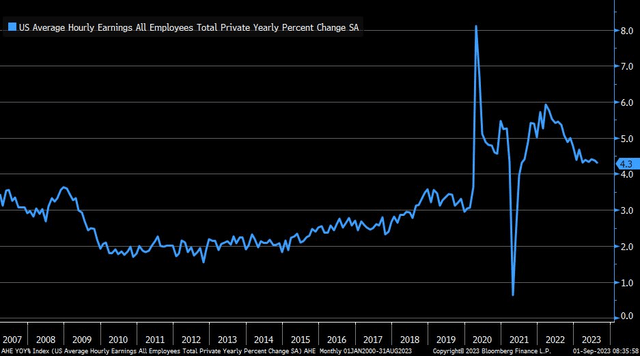
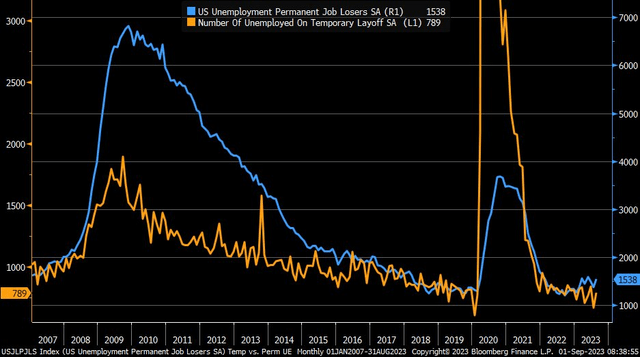
Capturing headlines was the unemployment rate’s surge to 3.8% – the highest since January of 2022 (4.0%) and well above economists’ forecasts of 3.5%. Average hourly earnings also saw a slight month-over-month increase of 0.2%, missing the expected 0.3% and down from the prior 0.4% rate. On a year-over-year basis, average hourly earnings remained steady at 4.3%, in line with expectations but modestly below 4.4% from July.
The U6 underemployment rate jumped from 6.7% to 7.1% – the highest in 18 months as the civilian labor force increased by a whopping 736,000 with more people re-entered the market for work. In August, the U.S. saw an increase in private payrolls, with 179,000 jobs added, exceeding the expected 148,000 and the revised previous figure of 155,000. The labor force participation rate increased to 62.8%, exceeding both the estimated 62.6% and the previous 62.6%. Considering the weak ADP report earlier this week and the trend lower in JOLTS, there are clear signs that the employment picture is turning less sanguine – exactly what the Fed wants to see.
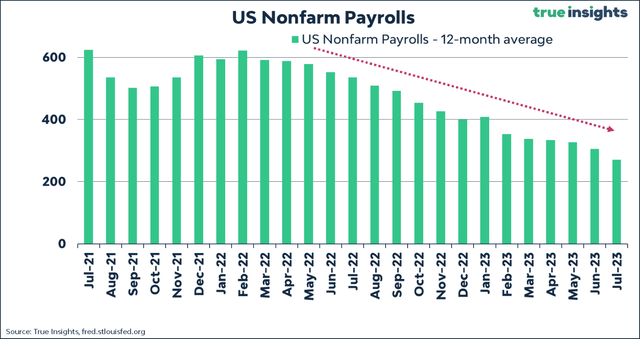
The jobs market remains healthy, but it is no longer hot. Sam Ro put it well – it’s like waiting for a bowl of hot soup (or pumpkin-spiced coffee) to cool off before enjoying it. Traders appear to have a taste for quicker rate cuts now, as the Fed Fund futures point to a cut in May next year, up a month from June expectations from before the NFP numbers.
August NFP Suggests A Cooler Economy, More Downward Revisions
Christian Fromhertz
Unemployment Rate Jumps, August Payrolls Rise MoM
BLS
The Jobs Growth Trend is the Fed’s Friend
TrueInsights
Average Hourly Earnings Falls to 4.3% YoY
Liz Ann Sonders
Unemployment Numbers Tick Up in August
Liz Ann Sonders
S&P 500 futures (SPX) rose about 10 points following the print, building on a 0.4% advance from before the announcement. Treasury yields continued their fall from last week’s highs. Given today’s jobs report that asserts that the labor market is indeed slowing, let’s assess the situation with intermediate-term Treasury securities.
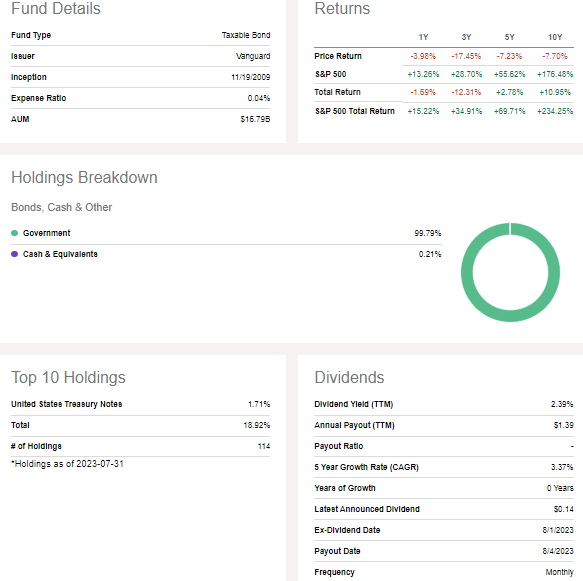
According to the issuer, (NASDAQ:VGIT) is the Vanguard Intermediate-Term Treasury Index Fund ETF Shares, an investment product aiming to offer a steady income by primarily investing in U.S. Treasury bonds. It carries a moderate level of interest rate risk and maintains a portfolio with an average maturity between 5 to 10 years.
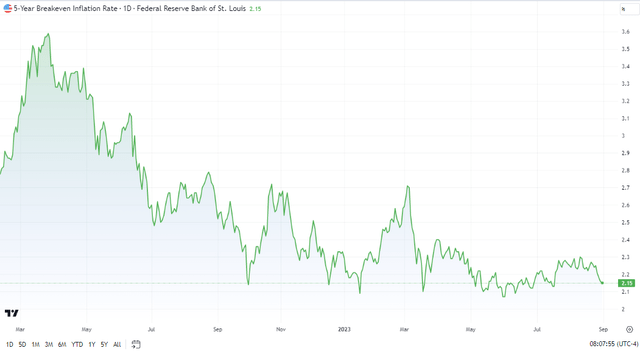
VGIT is a large exchange-traded fund, or ETF, with nearly $17 billion in assets under management, and it pays a trailing 12-month dividend yield of 2.4%. I urge investors to refer to a bond’s fund’s weighted average yield to maturity for a better gauge of its true expected yield. VGIT features a YTM of 4.2% as of July 31, 2023. Considering the 0.2 percentage point rise in rates in August, the real-time YTM is near 4.4%. That is about 2.2% above the 5-year breakeven inflation rate of 2.14%, implying a strong real yield. VGIT is a highly liquid fund with a low annual expense ratio of just four basis points.
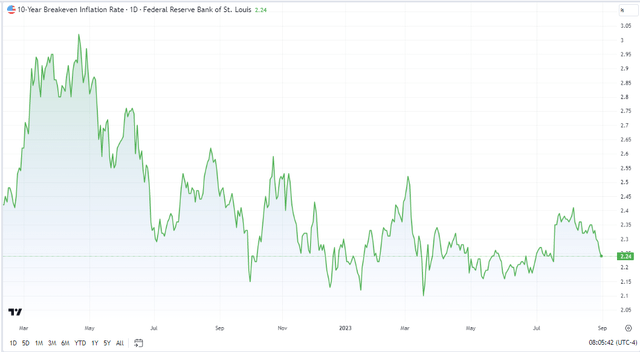
10-Year Breakeven Inflation Gives Back Its Summer Gains As Fears Ebb
TradingView
5-Year Breakeven Inflation Rate Dipping Once Again
TradingView
The VGIT fund is straightforward in that it simply holds Treasuries with maturities in the 3–10-year timeframe with a weighted average maturity of 5.6 years, leading to an effective duration of 5.1 years. That means for every one percent rise in Treasuries (near the 5-year mark), you can expect VGIT to lose 5.1% in its principal value. Of course, you are collecting the yield along the way. I assert that owning some part of the belly of the curve makes sense here and that it is an ideal time to push out duration modestly to lock in some higher yields considering that the Fed is near the end of its rate-hike cycle.
VGIT: The Belly of the Curve
Seeking Alpha
The Technical Take
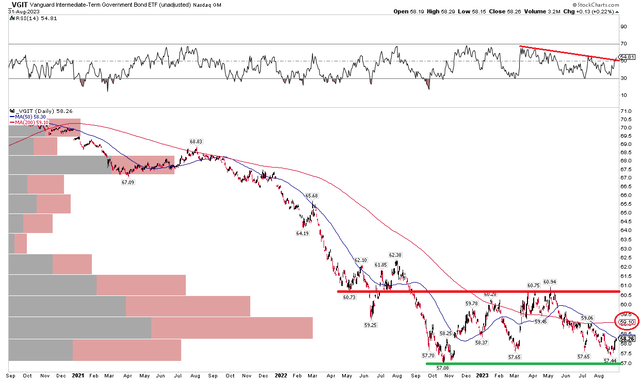
While Treasuries offer a decent real yield today, their momentum is not particularly impressive. Notice in the chart below that VGIT has been precariously testing its October 2022 low throughout this year. The $57 to $58 zone is key for the ETF to hold. A breakdown below that level, perhaps caused by a strengthening labor market as we head into the end of the year, would suggest a measured move price objective to the $53 to $54 range based on the nearly $4 range the fund has traded within over the past year. On the bullish side of the ledger, a breakout above $61 would lend credence to a favorable move probability – up to the early 2022 congestion zone of $64 to $65.
For now, a flat 200-day moving average asserts that the bulls and bears are battling it out. But also take a look at the RSI momentum indicator at the top of the chart – the line appears to be testing the downtrend. Hence, a breakout there could portent a later move higher in price, so this is a bullish potential sign for VGIT and something to monitor.
VGIT: Trading Range Persists as the Downtrend Pauses
Stockcharts.com
The Bottom Line
I have a buy rating on Vanguard Intermediate-Term Treasury Index Fund ETF Shares. I see some signs of a bottom and the yield today is much higher than the inflation rate that is expected. Moreover, as we encounter a tough seasonal stretch for the S&P 500 (SP500), going overweight intermediate-term Treasuries could be a prudent play over the short term.
Read the full article here


Leave a Reply