Investment Thesis
Have you ever contemplated the construction of a dividend income investment portfolio with a reduced risk level that aims to achieve an attractive Total Return, while incorporating both high dividend yield and dividend growth companies? To combine these goals is the essence and objective of The Dividend Income Accelerator Portfolio.
With last week’s incorporation of Apple (NYSE:AAPL) into The Dividend Income Accelerator Portfolio, we strived to optimize the portfolio regarding risk and reward. I believe that Apple provides investors with a relatively low risk level while offering an attractive expected annual rate of return, making the company from Cupertino an excellent risk/reward choice for investors. Due to Apple’s attractive risk/reward profile, I plan to overweight the Apple stock within The Dividend Income Accelerator Portfolio.
However, the inclusion of Apple into The Dividend Income Accelerator Portfolio also caused the Weighted Average Dividend Yield [TTM] of the portfolio to decrease to 3.66%.
For this reason, I have been focusing on picks that could help us to raise the portfolio’s Weighted Average Dividend Yield [TTM], since one of the portfolio’s objectives is to help you generate a significant amount of extra income via dividend payments.
One of the industries in which you can generally find companies that can pay a relatively attractive Dividend Yield is the Integrated Telecommunication Services Industry: both Verizon (NYSE:VZ) and AT&T (NYSE:T) currently pay a relatively attractive Dividend Yield (while Verizon’s Dividend Yield [FWD] stands at 8.17%, AT&T’s is at 7.40%).
Even though I consider Verizon the slightly more attractive choice when compared to AT&T (due to its higher Dividend Yield [FWD], its higher Dividend Growth Rate, and its higher Revenue Growth Rates), I have decided to select AT&T over its competitor.
The reason for this is that SCHD (NYSEARCA:SCHD) represents the largest proportion of The Dividend Income Accelerator Portfolio and this ETF is already invested in Verizon (with a proportion of 3.90%). I did not want the concentration risk to become too high for investors of The Dividend Income Accelerator Portfolio.
Nevertheless, I do not believe that AT&T is such an attractive risk/reward choice as Apple is, for example. I believe that the risk level for AT&T investors is not particularly low (reflected by the company’s relatively high Total Debt to Equity Ratio of 142.91%), and I believe that the reward for AT&T investors is relatively limited (due to the company’s limited growth perspective).
For this reason, I plan to underweight the AT&T stock within The Dividend Income Accelerator Portfolio. AT&T’s currently relatively high proportion of the overall portfolio will decrease within the coming weeks, when additional companies will be added.
However, I believe AT&T can play a significant role in the portfolio to help increase portfolio’s Weighted Average Dividend Yield and decrease its volatility and risk level.
The Dividend Income Accelerator Portfolio
The Dividend Income Accelerator Portfolio’s objective is the generation of income via dividend payments, and to annually raise this sum. In addition to that, its goal is to attain an appealing Total Return when investing with a reduced risk level over the long-term.
The Dividend Income Accelerator Portfolio’s reduced risk level will be reached due to the portfolio’s broad diversification over sectors and industries and the inclusion of companies with a low Beta Factor.
Below you can find the characteristics of The Dividend Income Accelerator Portfolio:
- Attractive Weighted Average Dividend Yield [TTM]
- Attractive Weighted Average Dividend Growth Rate [CAGR] 5 Year
- Relatively low Volatility
- Relatively low Risk-Level
- Attractive expected reward in the form of the expected compound annual rate of return
- Diversification over asset classes
- Diversification over sectors
- Diversification over industries
- Diversification over countries
- Buy-and-Hold suitability
AT&T’s Competitive Advantages
Brand Image
AT&T is ranked 22nd in the list of the world’s most valuable brands, while competitor Verizon is ranked 8th within the same ranking.
AT&T’s attractive ranking shows that the company can charge premium prices from its customers, providing the company with a competitive edge over competitors. This also helps to prevent other companies from entering AT&T’s business segment.
Strong Customer Base
AT&T has a broad customer base, which helps generate a stable and predictable income stream, providing the company with another competitive advantage.
Economies of Scale
AT&T has economies of scales, indicating that the company has cost advantages over smaller competitors (for example, due to the company’s lower average costs). These advantages provide AT&T with an economic moat over rivals that plan to enter its business field.
Broad Product Portfolio
AT&T has a broad product portfolio, enabling the company to offset the results of one division with those of another division. AT&T distinguishes between the following segments in which it operates:
- Mobility
- Business Wireline
- Consumer Wireline
AT&T’s broad product portfolio allows the company to bundle services and to do cross-selling, resulting in another competitive advantage for the company.
Each of the company’s competitive advantages contributes to the economic moat that AT&T has over competitors. Strong competitive advantages are essential for any company, since they help to survive over the long-term, protecting the invested money of investors.
The existence of AT&T’s competitive advantages has been crucial to include the company in The Dividend Income Accelerator Portfolio.
AT&T’s Valuation
Discounted Cash Flow Model for AT&T
At AT&T’s current stock price of $15.00, my DCF Model indicates an Internal Rate of Return of 8.6% for the company. In the table below, you can find the Internal Rate of Return for AT&T as according to my DCF Model when assuming different purchase prices.
|
Purchase Price of the AT&T Stock |
Internal Rate of Return as according to my DCF Model |
|
$10.00 |
13% |
|
$11.00 |
12% |
|
$12.00 |
11% |
|
$13.00 |
10% |
|
$14.00 |
9% |
|
$15.00 |
9% |
|
$16.00 |
8% |
|
$17.00 |
7% |
|
$18.00 |
6% |
|
$19.00 |
6% |
|
$20.00 |
5% |
Source: The Author
AT&T’s Dividend and Dividend Growth and the Projection of its Yield on Cost
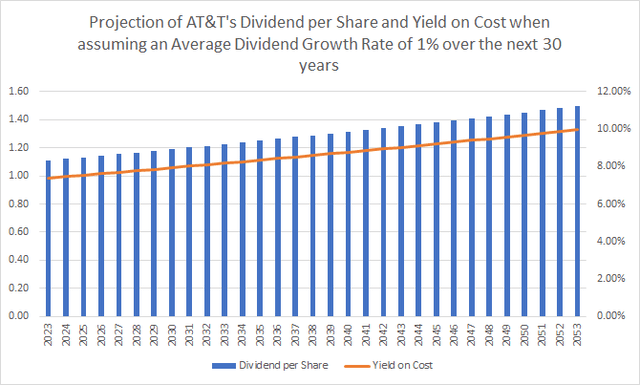
The graphic below shows a projection of AT&T’s Dividend and Yield on Cost when assuming an Average Dividend Growth Rate of 1% for the following 30 years. The company’s relatively low Payout Ratio of 44.05% contributes to the fact that I believe AT&T can be able to raise its dividend by at least 1% per year.
Assuming that you were to invest in AT&T at its current stock price of $15.00, you would be able to potentially reach a Yield on Cost of 8.17% by 2033, 9.03% by 2043, and 9.97% by 2053. Assuming the same Dividend Growth Rate of 1%, you could recoup your initial investment via dividend payments by 2035 (withholding taxes have not been included in this calculation).

Source: The Author
AT&T compared to its Peer Group
In the following, I will compare AT&T to Verizon, T-Mobile (NASDAQ:TMUS), BCE (NYSE:BCE) and Swisscom AG (OTCPK:SCMWY). It can be highlighted that among these 5 picks, T-Mobile is the largest in terms of Market Capitalization: while T-Mobile’s Market Capitalization stands at 164.35B, Verizon’s is 136.84B, AT&T’s is 107.31B, BCE’s is 34.87B, and Swisscom AG’s is 30.70B.
When it comes to Valuation, AT&T seems to be the most attractive pick among its peers: this is due to AT&T’s P/E [FWD] Ratio of 6.43, which lies below the one of Verizon (P/E [FWD] Ratio of 7.16), and significantly below the one of T-Mobile (19.06) and BCE (17.62).
AT&T also seems to be the most attractive pick when it comes to Profitability: this is the case, since its EBIT Margin of 23.02% is higher than the one of Verizon (EBIT Margin of 22.73%), T-Mobile (19.07%), BCE (22.30%) and Swisscom AG (21.14%).
Both Verizon (Dividend Yield [FWD] of 8.17%) and BCE (7.49%) have a slightly higher Dividend Yield [FWD] than AT&T (7.40%). Both also have shown significantly more Dividend Growth than AT&T: while BCE’s 5 Year Dividend Growth Rate [CAGR] stands at 10.52%, Verizon’s is 2.03%, and AT&T’s is -5.88%.
I believe that Verizon would provide investors with the best mix between dividend income and dividend growth, combined with a reduced risk level (Verizon has a 60M Beta Factor of 0.33 compared to AT&T’s, which is 0.75).
However, since SCHD is the largest position of The Dividend Income Accelerator Portfolio, and Verizon has a proportion of 3.90% within the ETF, I have opted to include AT&T in The Dividend Income Accelerator Portfolio at this moment in time, in order to decrease concentration risk. In the future, however, I will also consider incorporating Verizon into the portfolio.
|
T |
VZ |
TMUS |
BCE |
SCMWY |
|
|
Company Name |
AT&T |
Verizon |
T-Mobile |
BCE |
Swisscom AG |
|
Sector |
Communication Services |
Communication Services |
Communication Services |
Communication Services |
Communication Services |
|
Industry |
Integrated Telecommunication Services |
Integrated Telecommunication Services |
Wireless Telecommunication Services |
Integrated Telecommunication Services |
Integrated Telecommunication Services |
|
Market Capitalization |
107.31B |
136.84B |
164.35B |
34.87B |
30.70B |
|
P/E GAAP [FWD] |
6.43 |
7.16 |
19.06 |
17.62 |
– |
|
Dividend Yield [FWD] |
7.40% |
8.17% |
0.47% |
7.49% |
4.04% |
|
Dividend Growth 5 Yr [CAGR] |
-5.88% |
2.03% |
– |
10.52% |
0.86% |
|
Consecutive Years of Dividend Growth |
0 Years |
18 Years |
– |
3 Years |
1 Year |
|
Revenue 3 Year [CAGR] |
-11.49% |
1.34% |
14.96% |
1.94% |
-0.41% |
|
EBIT Margin |
23.02% |
22.73% |
19.07% |
22.30% |
21.14% |
|
Return on Equity |
-5.97% |
23.39% |
9.05% |
11.16% |
15.61% |
|
60M Beta |
0.75 |
0.33 |
0.55 |
0.49 |
0.16 |
Source: Seeking Alpha
Why AT&T aligns with the investment approach of The Dividend Income Accelerator Portfolio
- AT&T currently has a Free Cash Flow Yield [TTM] of 16.95%, which shows us that the company’s current stock price is not based on high growth expectations, aligning with the approach of The Dividend Income Accelerator Portfolio.
- My DCF Model currently indicates an Internal Rate of Return of 9% for AT&T at the company’s current price level, indicating that the reward can be relatively attractive for investors.
- AT&T currently pays shareholders a Dividend Yield [FWD] of 7.40%. The company’s Payout Ratio stands at 44.05%, implying that there is plenty of room for dividend enhancements and indicating that the company should not cut its dividend in the near future (a dividend could have a strong negative impact on the company’s stock price, affecting the Total Return of The Dividend Income Accelerator Portfolio negatively).
- The inclusion of AT&T into The Dividend Income Accelerator Portfolio helps us to raise the portfolio’s Weighted Average Dividend Yield [TTM], increasing the amount of extra income that you can generate via dividend payments, once again aligning with the approach of The Dividend Income Accelerator Portfolio.
- However, I would like to point out that I plan to underweight the AT&T position in The Dividend Income Accelerator Portfolio. This is the case, because I believe that the risk level for investors is relatively high and the reward for investors is limited (due to the company’s limited growth perspectives). The fact that AT&T is currently one of the largest positions of The Dividend Income Accelerator Portfolio is only a temporary factor. The idea behind The Dividend Income Accelerator Portfolio is to only overweight those kinds of companies that are most attractive in terms of risk and reward.
Investor Benefits of The Dividend Income Accelerator Portfolio after Investing $100 in AT&T
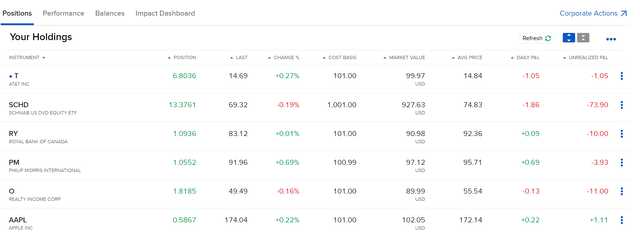
Through the acquisition of shares of AT&T for the amount of $100, we have managed to raise the Weighted Average Dividend Yield [TTM] of The Dividend Income Accelerator Portfolio. Now, the portfolio’s Weighted Average Dividend Yield [TTM] stands at 3.90%. However, through the acquisition, the portfolio’s 5 Year Weighted Average Dividend Growth Rate [CAGR] has slightly decreased to 10.24%.

Source: Interactive Brokers
Through the acquisition of AT&T we have not only raised the Weighted Average Dividend Growth Rate of the portfolio, we have also decreased the portfolio’s risk level. Proof of this is AT&T’s low 60M Beta Factor of 0.75, which indicates that we can reduce portfolio volatility by including AT&T in The Dividend Income Accelerator Portfolio.
Since several companies that are part of The Dividend Income Accelerator Portfolio have a 60M Beta Factor below 1, The Dividend Income Accelerator Portfolio provides investors with a reduced risk level. This matches with the investment approach of The Dividend Income Accelerator Portfolio: the portfolio provides you with a reduced risk level, while helping you to generate an attractive extra income via dividends and to increase this amount annually.
Risk Factors
Such as mentioned earlier in this analysis, it can be highlighted that we have managed to reduce The Dividend Income Accelerator Portfolio’s volatility and risk level by the inclusion of AT&T (which has a 60M Beta Factor of 0.75).
Nevertheless, investors should take into consideration different factors that represent risk factors for AT&T investors:
AT&T’s intense competition and its limited Growth Perspective
One of the risk factors that I see for AT&T investors is the company’s strong competition with companies such as Verizon and T-Mobile. In recent years, T-Mobile has shown significantly higher Growth Rates than AT&T: while AT&T has shown a 5 Year Revenue Growth Rate [CAGR] of -5.17%, Verizon’s is 0.81%, and T-Mobile’s is 13.45%. These numbers also reflect AT&T’s limited growth perspective, which I consider to be a significant risk factor for its investors.
A Possible Dividend Cut
Another risk factor for AT&T investors is a possible future dividend cut. A dividend cut would probably have a significant impact on the company’s stock price, which would than affect negatively the Total Return of The Dividend Income Accelerator Portfolio. For these reasons, we aim to avoid any dividend cut of a position that is part of our investment portfolio. With a current Payout Ratio of 44.05%, I believe that the probability of a dividend cut for AT&T in the near future is relatively low.
AT&T’s Debt Level
AT&T has a relatively high Total Debt to Equity Ratio of 142.91%. In addition to that, it is worth mentioning that the company has a Baa2 credit rating from Moody’s. Obligations with this rating are subject to a moderate credit risk. These metrics and characteristics strengthen my opinion not to overweight the AT&T position in an investment portfolio.
Final thoughts about the risks for AT&T investors
Through the acquisition of AT&T for The Dividend Income Accelerator Portfolio, AT&T became temporarily one of the portfolio’s largest positions.
However, with additional acquisitions for The Dividend Income Accelerator Portfolio, I plan to reduce AT&T’s overall portfolio percentage. I believe that AT&T is not attractive enough in terms of risk and reward to overweight the company in an investment portfolio. However, I believe that AT&T can play an important role in our portfolio to increase the portfolio’s Weighted Average Dividend Yield and reduce its volatility, contributing to decrease the portfolio’s risk level.
Conclusion
With the previous acquisition of Apple for The Dividend Income Accelerator Portfolio, we have optimized the portfolio in terms of risk and reward. I strongly believe that Apple is one of these picks that provide investors with a relatively low-risk level (helping us increase the probability of making excellent investment decisions) while offering an attractive expected annual rate of return.
By including AT&T into The Dividend Income Accelerator Portfolio, we have now managed to increase the portfolio’s Weighted Average Dividend Yield [TTM] and to decrease its volatility and risk level. AT&T currently pays a Dividend Yield [FWD] of 7.40% and has a 60M Beta Factor of 0.75, indicating that it can contribute to reducing portfolio volatility.
Now, The Dividend Income Accelerator Portfolio provides investors with a Weighted Average Dividend Yield [TTM] of 3.90% and a Weighted Average Dividend Growth Rate [CAGR] of 10.24%. These metrics indicate that The Dividend Income Accelerator Portfolio blends dividend income with dividend growth.
Isn’t it great to be able to invest with a reduced risk level, to combine dividend income with dividend growth, and to strive for an attractive Total Return at the same time?
This is the objective of The Dividend Income Accelerator Portfolio! The Portfolio provides you with stability and protection (helping you sleep well while investing), offers attractive dividend payments combining both high dividend yield and dividend growth companies, and allows you to accumulate wealth in both bullish and bearish market scenarios.
Are you still thinking about implementing the investment approach of The Dividend Income Accelerator Portfolio, or have you already started its implementation?
Author’s Note: Thank you for reading! I would appreciate hearing your opinion on my selection of AT&T as the sixth acquisition for The Dividend Income Accelerator Portfolio. I also appreciate any thoughts about The Dividend Income Accelerator Portfolio or any suggestion of companies that would fit into the portfolio’s investment approach!
Editor’s Note: This article discusses one or more securities that do not trade on a major U.S. exchange. Please be aware of the risks associated with these stocks.
Read the full article here


Leave a Reply