Research Summary
Continuing this week on the theme of technology and specifically artificial intelligence, on the heels of attending a tech conference in Europe which I mentioned in my previous article, today I’ll be covering a slightly different kind of tech company but one that helps make many things in tech possible.
Applied Materials (NASDAQ:AMAT), which is in the subsector of semiconductor materials & equipment, released its FY2023 Q3 earnings report on Aug. 17th and we will look at some of that data as well as from other sources.
For readers less familiar with this company, a few relevant points from their website are: calls itself world’s #1 semiconductor & display equipment company, involved in 24 countries, over 17K patents, in business over 55+ years, based in Silicon Valley, stock trades on the NASDAQ.
Two key peers of this company, according to Seeking Alpha data, are Lam Research (LRCX) and Teradyne (TER).
Rating Methodology
Using a streamlined, structured process, I break down my overall holistic rating of this stock into 5 categories I rank individually and of equal weight: dividends, valuation, share price, earnings growth, company financial health.
If I recommend this stock on at least 3 of 5 categories, it gets a hold rating. 4 of 5 gets a buy, and less than 3 gets a sell rating. Then I compare my rating to the consensus from analysts, Wall Street, and the SA quant system.
Then, I explain any upside or downside risks to my outlook.
Dividends
In this category, I will analyze the dividends of this stock and whether I think they present an opportunity for dividend-income investors. The data comes from Seeking Alpha dividend info.
As of the writing of this analysis, the forward dividend yield is 0.94%, with a payout of $0.32 per share on a quarterly basis, with an upcoming ex date of Nov. 22nd, which could be an opportunity to take advantage of.
I would also mention than I don’t often find tech stocks that even pay a dividend at all, so ones like this that come up are certainly worth another look. I see it as a way to generate cashflow and not just hold on to shares.
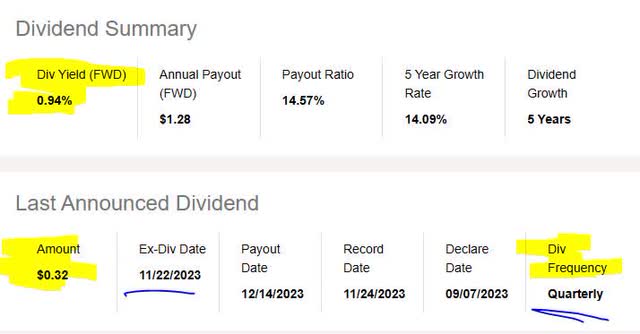
Applied Materials – div yield (Seeking Alpha)
When comparing to its sector average, this dividend yield is 46% below its sector average.
I believe this is a moderately negative point to consider for dividend investors who are comparing multiple stocks in which to invest. In my opinion, my target range for dividend yield in this sector is 1.5% – 2.5%, to stay within a few points of the sector average but preferably just above it to be competitive.
In this case, the yield seems low vs the average, and even got a D+ grade from Seeking Alpha which does not add confidence to my rating.
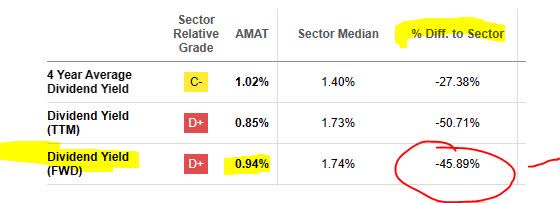
Applied Materials – div yield vs sector (Seeking Alpha)
However, where it lacks in yield I think it makes up in dividend growth and stability over a longer period.
In looking at the 5-year dividend growth for this stock, it has shown a positive growth trend over those 5 years.
This is, in my opinion, a positive for dividend investors and a sign of this firm’s capacity to return capital back to shareholders.
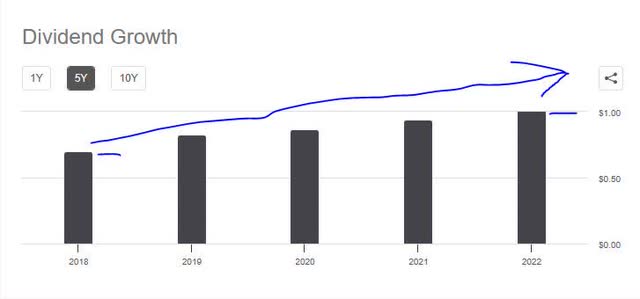
Applied Materials – dividend 5 yr growth (Seeking Alpha)
Additionally, I am looking for stability with dividend payouts, and this stock has shown regular quarterly dividend payment history lately without interruption, a positive point to think about.
In the table below (which shows the ex-date on the far right), we can see the dividend was hiked twice since 2021. Many dividend investors rely on the quarterly income / cashflow that these types of stocks provide, though not all investors focus on dividends however, as other ways to generate cashflow would be selling covered call options for example, that is after researching all the risks & rewards of those.
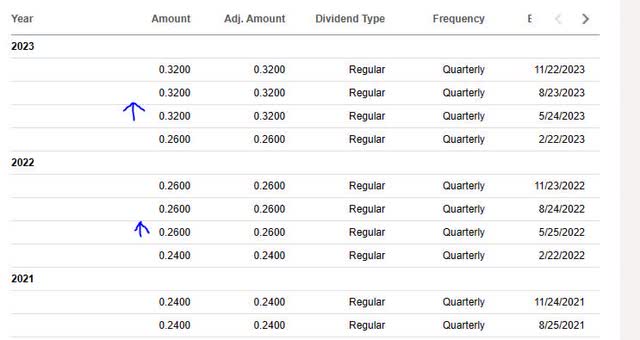
Applied Materials – dividend history (Seeking Alpha)
Based on the above evidence holistically, I would recommend this company on the category of dividends.
Valuation
In this category, I will analyze the valuation of this stock. The data comes from valuation info on Seeking Alpha, specifically the forward P/E ratio and forward P/B ratio, the key metrics I look at since I want to see where the market is pricing this stock in relation to its earnings and book value. I usually prefer a valuation near the average or somewhat below it.
This stock has a forward P/E ratio of 17.79, which is 29% below its sector average.
I think that a reasonable price to earnings for this stock would be between 15x earnings and 26x earnings, to stay near the average or a few points below it, considering that the tech sector seems very overvalued lately just from looking at these numbers which show 25x forward earnings being the sector average, unlike the banking sector I also cover which seems to be somewhere closer to 10x earnings.
In this case, I like this stock at its 17x – 18x forward earnings range so I think it is reasonably valued on earnings. This is another positive point for this stock.
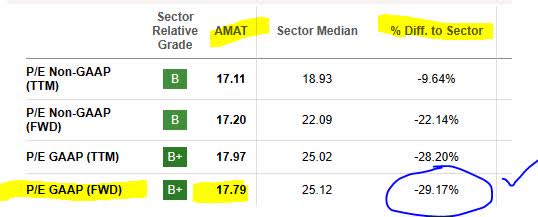
Applied Materials – PE ratio (Seeking Alpha)
When it comes to price-to-book value, the story is different. This stock has a forward P/B ratio of 7.25, which is 95% above its sector average.
I think that a reasonable fwd price-to-book value for this stock could be between 2x book value and 4.5x book value, to stay close to average or somewhat below it.
In this case, it appears considerably overvalued in this metric.

Applied Materials – PB ratio (Seeking Alpha)
In my opinion as an analyst I think although the price to book value is high, it is offset by the attractive price to earnings so based on the examples I gave I would recommend this stock on the basis of valuation.
Share Price
Next, I determine if the current share price is a potential buying opportunity. My portfolio goal I am testing with a fictitious trade is to buy at current price, holding for 1 year until Aug. 2024, and achieving an unrealized gain of +10% at that time. The 1 year holding period is to earn a full year of dividend income as well.
The price chart (as of the writing of this article) shows the last closing share price of $136.17, compared to its 200-day simple moving average “SMA” of $125.46, over the last 1-year period. I like using the 200-day SMA as it is a long-term trend indicator that smooths out the price trend nicely.
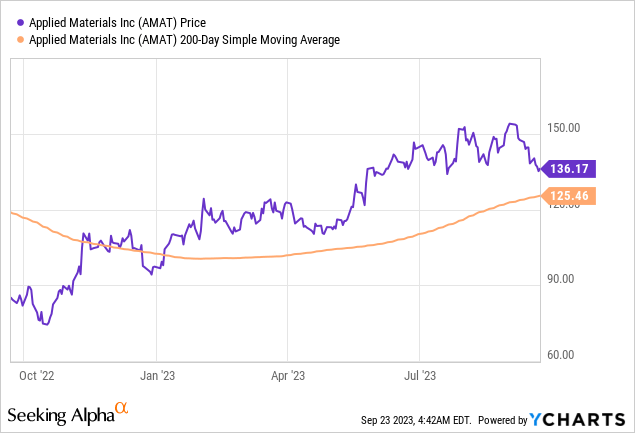
Next, I plug in the current 200-day SMA and share price into the following simulator I created, which simulates unrealized gains & losses if the share price as of Aug. 2024 reaches +10% above the current SMA but also if it drops -10% below the current SMA:

Applied Materials – investing idea (author analysis)
In the above simulation, my goal is to meet or exceed a +10% unrealized gain in 1 year, and I have a maximum loss tolerance of -10% unrealized loss. I think it is important to test both potential gains and the risk of potential losses too.
Based on the simulation results testing the current buy price, I came short of my goal of a 10% capital gain, and exceeded my loss tolerance of a -10% capital loss.
The following illustration shows that the current share price of $136.17 seems to be near the top of my “trading range” which is a +/- 10% vs the moving average. So, in this scenario it appears overpriced, though does not mean it cannot keep going up further.
However, if you look at the chart it seems to be consistent with the overall tech sector heating up sometime this spring and the bullish momentum behind that sector, particularly, after the March dip in bank stocks. I would question whether the tech bulls will continue to show their horns and I welcome your feedback on this topic in the comments section!
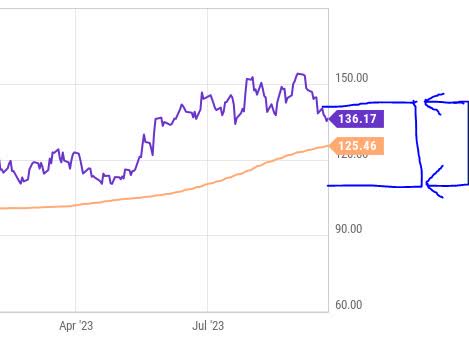
Applied Materials – trading range (author analysis)
In this case, holistically I would not recommend the current buying price.
Since every investor has different profit goals and risk profiles, consider this simulator just a general framework to help think about this stock in a longer-term sense.
Earnings Growth
In this category, I examine the earnings trends over the last year, looking at both top-line and bottom-line results but also any relevant company commentary from the last earnings results.
A negative point I would call out on this stock is that the company’s total revenues as well as net income both saw YoY declines at the end of the last fiscal quarter.

Applied Materials – revenue YoY (Seeking Alpha)

Applied Materials – net income YoY (Seeking Alpha)
From the company’s own earnings release, we get an even better view and it is not terrible but not great either: YoY drops in net sales, operating margin, and net income.

Applied Materials – net sales (company quarterly earnings)
Based on this data as whole, I would not recommend in the category of earnings growth since they saw drops in both their top-line and bottom-line in the last quarter. Also, since Oct 2022 they saw 3 straight quarters of declining revenues, which I think is a considerable headwind.
Financial Health
In this category, I will discuss whether the overall company shows strong financial fundamentals beyond just things like dividends, valuation, earnings and share price, with a focus on the capital strength.
This category appears rosier than the last one, and the company earnings comments add confidence to my sentiment:
The company generated $2.58 billion in cash from operations and distributed $707 million to shareholders including $439 million in share repurchases and $268 million in dividends.
Further, I cannot stress the importance I place on positive cash flow in a business, since I also manage one from my home office, and in looking at this firm it is evident that they consistently have positive cash flow they can brag about. The following is from their fiscal Q3 presentation:

Applied Materials – cash flow (company earnings presentation)
Another positive call-out is their balance sheet, which shows growth in cash over the last 3 fiscal quarters and a cash position of $6B+. This to me is a sign of a serious company and not another Silicon Valley startup that may or may not last next year.
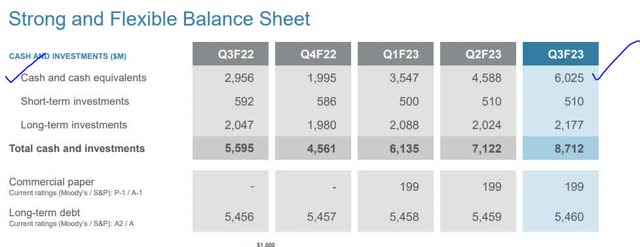
Applied Materials – balance sheet (company earnings presentation)
Based on the data, I recommend in this category, and consider it a firm with solid fundamentals in terms of balance sheet, cash flow, and returning capital back to shareholders.
Rating Score
Today, this stock won in 3 of my 5 rating categories, earning a hold rating from me today.
In today’s rating, I am essentially agreeing with the consensus from the SA quant system, which also gave this stock a hold rating. However, I am less bullish than the consensus from analysts:
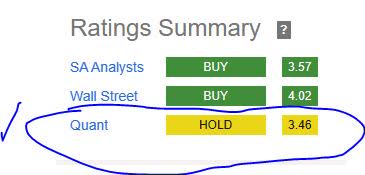
Applied Materials – rating consensus (Seeking Alpha)
My Rating vs. Downside & Upside Risk
My neutral rating can face both upside and downside risks tied to whether this company can capture more market share & revenue in an increasingly AI-driven tech world dependent on semiconductors, but also a market dominated by several big players in this space who could beat this firm in terms of revenue growth.
What is not denying is that the market potential, a whopping $1T+ by 2030, is certainly an opportunity for those that make the materials that power today’s computing. Particularly when it comes to artificial intelligence, the need for faster and more powerful but efficient processing is growing.
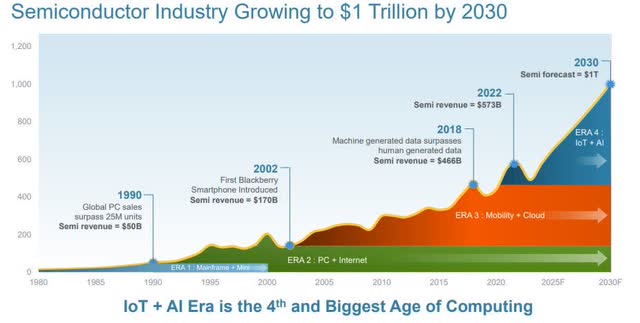
$1T semiconductor market potential (Applied Materials – quarterly presentation)
At the same time, I am not convinced that being overly bullish on Applied Materials is justified, nor overly bearish, since it occupies the #7 spot on Investopedia’s list of top semiconductor companies. Not bad but not great, either.
Well ahead of the pack on that 2023 list are Intel (INTC), Qualcomm (QCOM), and Micron Technology (MU), for example.
So, my hold rating stands and I remain modestly neutral about this company.
Analysis Wrap-up
To wrap up today’s discussion, here are the key points we went over:
This stock got a hold rating today.
Its positive points are: dividend growth /stability, P/E ratio below sector average, company financial strength.
The headwinds it faces are: overpriced, lack of YoY earnings growth.
Both upside & downside risks have been addressed.
In closing, as in my last article I will keep an eye on this stock as well to see what it does in the “AI” space which is a relevant topic to follow, I think.
At the same time, I want to see what its bigger competitors do as well, as multiple whales are trying to get a piece of the “AI” pie it seems.
Read the full article here


Leave a Reply