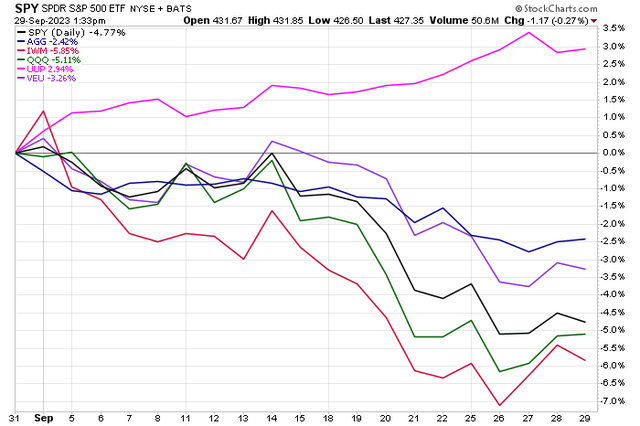
September lived up to its moniker. Notoriously the worst month of the year for the markets, the S&P 500 (SP500) fell 5% with comparable losses on the Nasdaq 100 (QQQ). Small caps suffered larger losses – the Russell 2000 ETF (IWM) gave back 6% to narrow its percentage-point year-to-date gain to the low single digits. While domestic equities struggled, so did foreign stocks. The Vanguard All-World Ex-US ETF (VEU) outperformed but still declined by 3%.
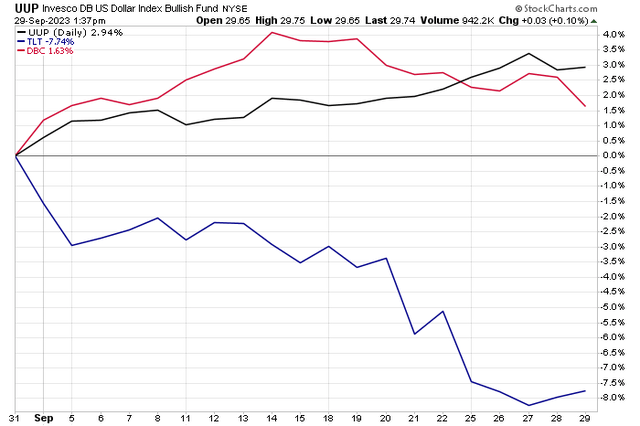
There’s no doubt that a triple threat has emerged to temporarily halt the bull market. First, the US Dollar ETF (UUP) rallied 3% in September. Meanwhile, long-term Treasury yields soared – the 30-year yield rose ever closer to the 5% mark (the 20-year rate actually touched that psychological level for a moment on September 28). In all, the 20+ year Treasury ETF (TLT) fell 8% on a total return basis. Finally, higher oil prices further crimped the consumer: WTI edged above $95 by late in the month while the spot price of a barrel of Brent came within earshot of $100.
Stocks endured weakness on the final day of the quarter amid growing jitters of a protracted government shutdown. Along with labor strikes and the resumption of student loan repayments, there are plenty of reasons to be cautious heading into Q4.
September Returns: Dollar Up, Equities Broadly Lower
StockCharts.com
Macro Triple Play: Higher Rates, Stronger Dollar, Rising Oil
StockCharts.com
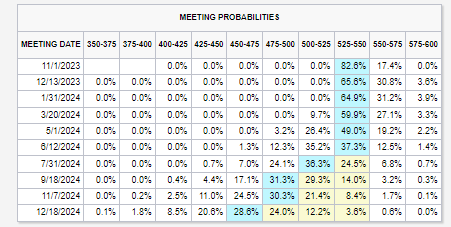
On the economic front, the Fed held rates steady at its September 20 policy meeting. With the current target rate range of 5.25-5.50%, there is just a modest chance of a final hike at the November 1 FOMC gathering. With persistent inflation, however, there remains a 35% probability of a quarter-point rate increase – potentially coming as late as the first Fed meeting of 2024 (January 31).
Rate Hike Probabilities: Just a 17% Chance of a November Increase
CME FedWatch Tool
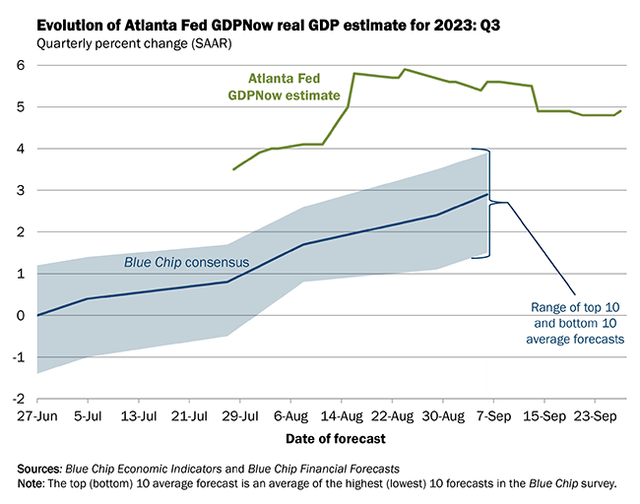
Driving the “higher for longer” narrative that you can’t miss if you tune into financial TV for more than five minutes is the robust U.S. economy. As of late September, the Atlanta Fed’s GDPNow tool shows third quarter growth humming along at a 4.9% seasonally adjusted annual rate. Many pundits had expected that gauge to cool as quarter-end approached, but relentless job growth and consumer spending keep pushing out the “Waiting for Godot” recession.
US Q3 GDP Growth Above-Trend, Per the Atlanta Fed’s GDPNow Model
Atlanta Federal Reserve
Looking ahead, all eyes are on how the corporate earnings season will verify. As it stands, FactSet notes that Q3 S&P 500 (SP500) earnings are expected to be about flat, but if the one -0.1% year-on-year EPS dip is realized, then it will mark the fourth consecutive quarterly earnings decline. Concerningly, among the 116 companies that have issued guidance for the upcoming reporting period, just 42 firms offered upside earnings estimates. Heading into Q4, the S&P 500’s forward 12-month operating P/E ratio is 17.9, above the 10-year average of 17.5.
S&P 500 Forward P/E Ratio: Near Its Long-Term Average
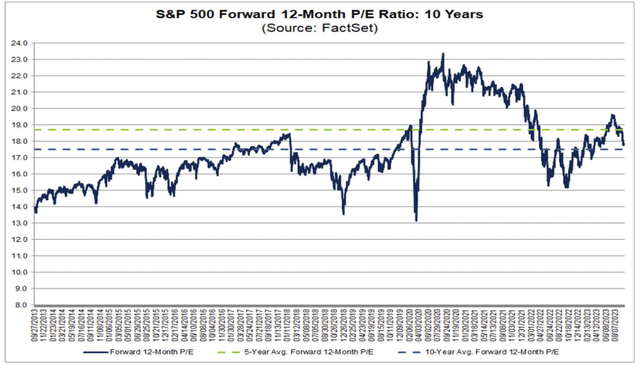
FactSet
How about some good news? Q4 is historically the best on the calendar. According to Goldman Sachs, since 1985, the S&P 500 has had a median return of 6.1% in Q4 and a better than 80% positive performance rate. Importantly, the S&P 500 has actually followed seasonal trends quite well this year.
We had a hot start in January, but then equities faltered starting on Groundhog Day, eventually finding a bottom in mid-March amid the height of the regional banking turmoil. An AI-fueled recovery through July also expanded market breadth, but the bears finally came out of hibernation in August and this past month – right on cue from a seasonal perspective. Will the trend continue? Investors seem skittish about such prospects given the dismal end to September.
The Bulls’ Time to Shine?
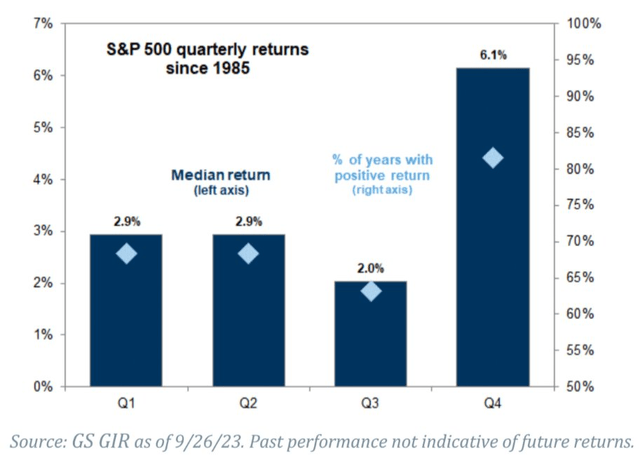
Goldman Sachs
Where should you position your portfolio now? If you are like the many investors pouring cash into zero-duration money market funds, then considering extending duration just modestly could be a savvy move. Of course, rising interest rates would hurt fixed-income assets but given today’s loftier yields and uncertainty regarding if the Fed has ended its tightening campaign, stepping out modestly into short-duration Treasury securities would lock in today’s relatively high yields.
I have a buy rating on the iShares 3-7 Year Treasury Bond ETF (NASDAQ:IEI)
For background, IEI seeks to track the investment results of an index composed of US Treasury bonds with remaining maturities between three and seven years, according to iShares. This part of the curve finally features yields north of 4.5%. The current average yield to maturity on IEI is 4.7% as of September 28, 2023. On expenses, IEI is a very cost-effective vehicle considering its 0.15% annual expense ratio, and it scores well on risk metrics, per Seeking Alpha. In terms of liquidity, average daily volume is high at nearly 1.6 million shares and the 30-day median bid/ask spread is a single basis point. Investors might also consider a rival fund, the Schwab Intermediate-Term U.S. Treasury ETF (SCHR) which has an expense ratio of just three basis points.
IEI: Trading Data & Peer Comparison
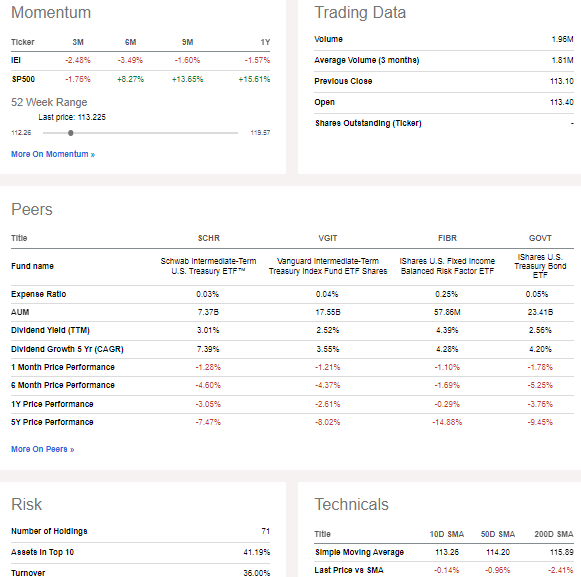
Seeking Alpha
Seasonally, IEI tends to trade about sideways in Q4 after a strong Q3, according to data from Equity Clock. So, if calendar trends play out in fixed income, then a pause in the rate rise could be in play. Treasuries have not followed the normal annualized path, unlike equities.
IEI Seasonality: Neutral October-December
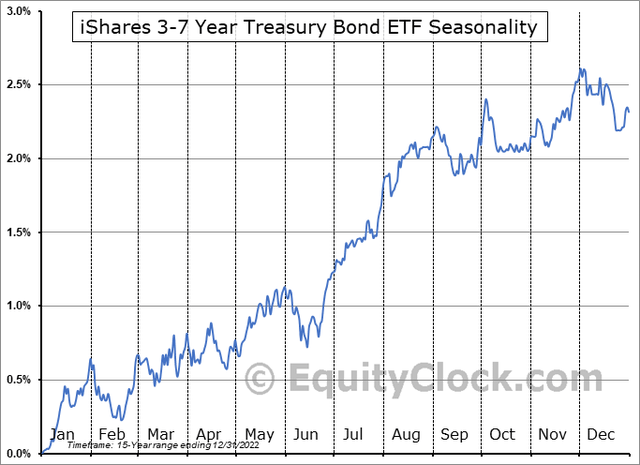
Equity Clock
The Technical Take
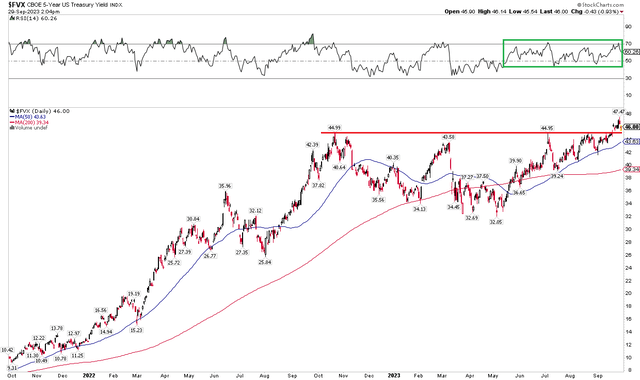
While the fundamental reason to include some duration is straightforward, the technical picture of the 5-year Treasury yield (FVX) offers clues as to how Q4 might unfold. Notice in the chart below that FVX broke out above a key spot in September. The 4.5% level marked a spot where buyers of notes stepped up to the plate. Intense selling across much of the yield curve since early May with further selling pressure finally took FVX above the 4.5% barrier.
The trend here is certainly higher, so I do not advise going all-in 3-5-year government notes but considering that this section of the curve is approaching a real yield of 2.5% – the highest in more than 20 years (sans the GFC volatility), snatching part of that better rate could be prudent. If we see the FVX break back under 4.5%, then that would warrant adding to a position in IEI.
For now, with strong trends in the RSI momentum indicator at the top of the chart, keeping your long position small is warranted given price action.
5-Year Treasury Yield: Breakout Above 4.5%
StockCharts.com
5-Year Nominal vs. Real Yields – 1/2/03-9/27/23

WisdomTree
The Bottom Line
Stocks continued their corrective phase in September. After peaking in late July, equities have struggled amid a strong dollar, rising yields, and a surge in oil prices. Seasonal trends are on the side of the bulls, though. Furthermore, with the Fed potentially through with its rate-hiking campaign, extending fixed income duration from zero (cash) could be a wise play as economic growth eases.
Read the full article here


Leave a Reply