Stock Market Seasonality Provides Reliable Clues for the Rest of 2023
The last 21 months has been a financial “roller coaster”! Many of the broader stock market benchmarks finished September with mediocre results for 2023 and nowhere near their all-time highs set in 2021.
Beleaguered investors are looking for time-tested guidance, especially as we face the infamous month of October with its history of bear market declines in 1929, 1987 & 2008.
History supports the fact that the Fall & Winter months usually produce powerful rallies. In fact, the financial media has lots of colorful phrases to describe stock market seasonality, but one that seems to come true is, “The Santa Claus Rally” as the holiday season typically posts strong results.
What is the Stock Market Seasonality?
This well-known technical analysis is commonly defined as the stock market’s typical price movement through different periods of time not particularly tied to a calendar year or economic conditions. It’s largely based on the theory that current stock market momentum feeds trends in the future!
For decades, market forecasters have observed that during the eight months of October through the following May, the stock market posts significant rallies while the “dog days” of Summer (June to September) are volatile and trendless!
Reliable & consistent – Yes!
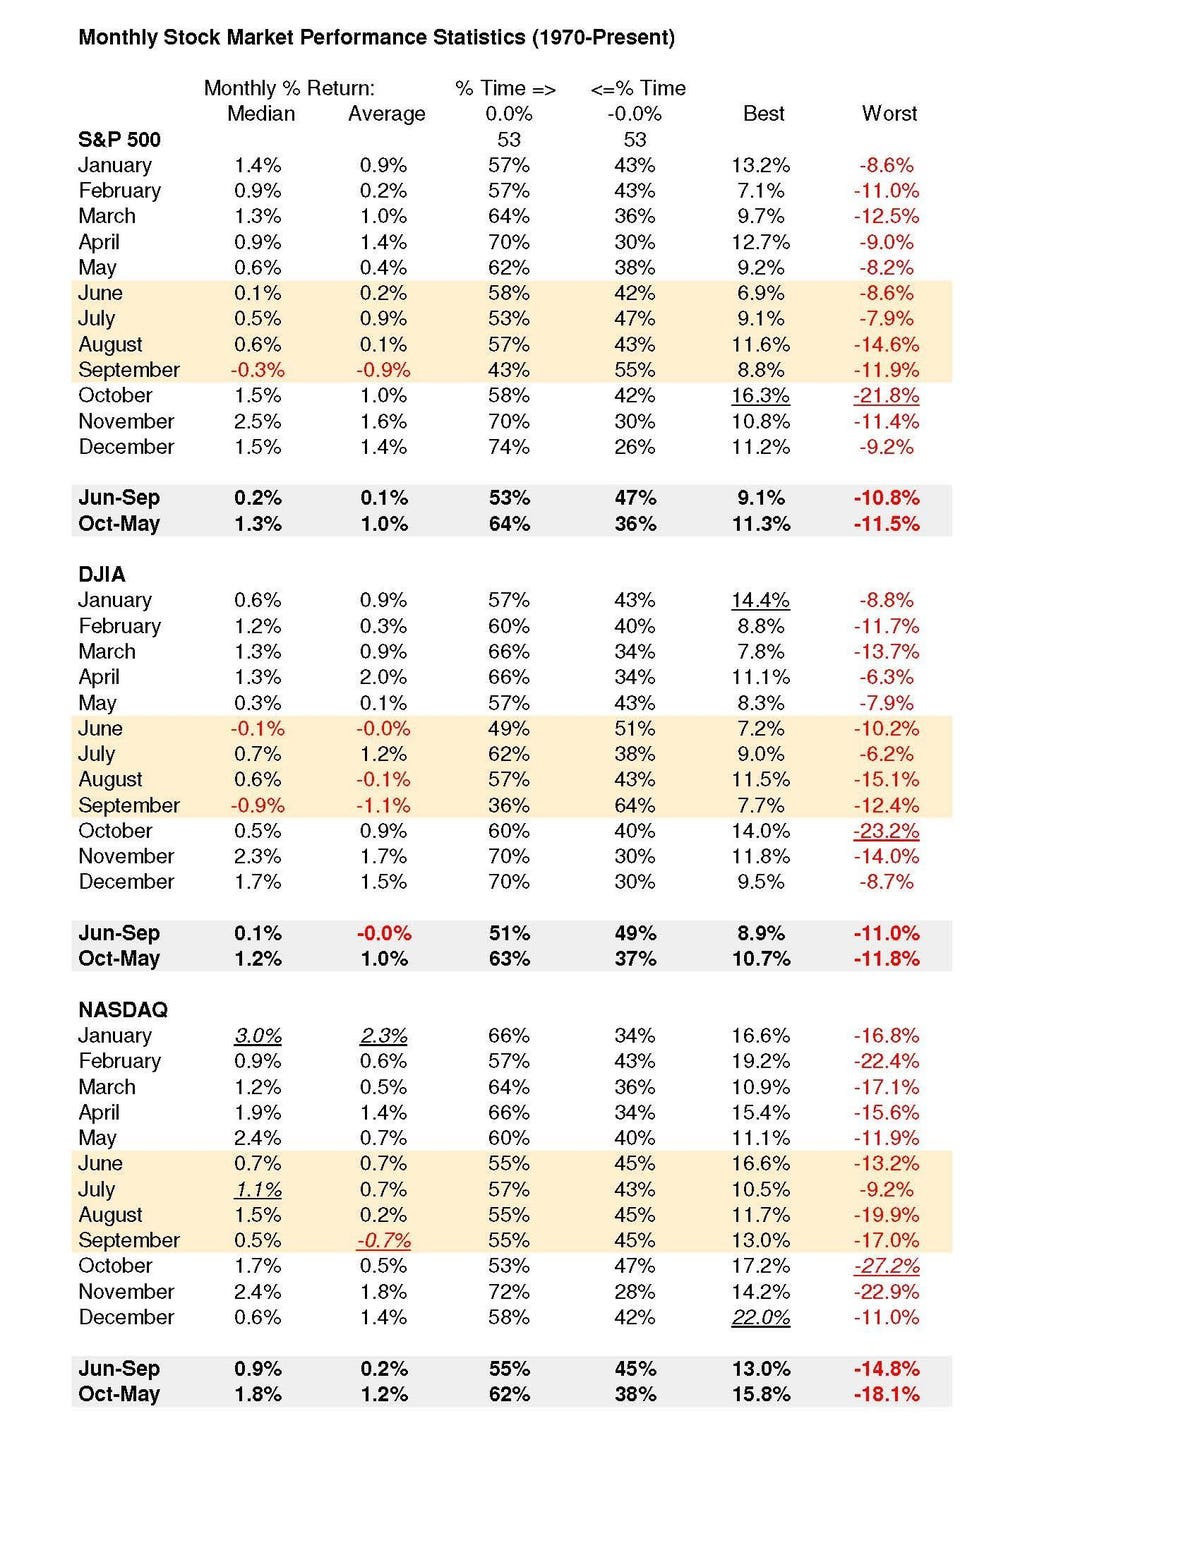
Market analysis should be tested over a long period of time, in different economic conditions, and using various benchmarks (See Table).
Since the inflationary 1970s, the S&P 500, Dow Jones Industrials and NASDAQ Composite have posted median and average results exceeding 1% per month from October to the following May!
In stark contrast, the Summer months posted pitiful results averaging 0.1% with September as the worst performing month averaging -1% for all three indices. Simply put, the old saying, “Sell in May and go Away” holds true!
While these results are reliable, October can be extremely volatile in both directions. It has the distinction of being the only month in which all indexes lost at least 17% (1987 & 2008). It also saw the highest percentage gain of any month of the year for the S&P 500 and DJIA (16% in 1974 & 14% in 2022)!
I have been a portfolio manager for over 30 years and have successfully integrated stock market seasonality into investment analysis. In fact, I typically increase cash and/or hedge stock portfolios in May and rarely have cash sitting on the sidelines after Halloween.
Although market seasonality should be observed by investors, there is no “magic” stock market indicator, and veteran market forecasters use a variety of statistics in trying to “peak around the corner” in search of the next bull or bear market.
Read the full article here