Amidst the dynamic cryptocurrency landscape, Litecoin (LTC) is garnering attention, not only for its appreciable price movement but also for its soaring trading volume, placing it among the top 10 most traded coins.
Currently trading at $64.34, Litecoin has witnessed a positive shift of nearly 1.50% within the past 24 hours.
A glance at CoinMarketCap indicates its ranking at #15, fortified by a robust live market capitalization of approximately $4.74 billion.
Further, with a circulating supply of 73,612,302 LTC out of a predetermined cap of 84,000,000 LTC, market speculators are eager to see if Litecoin has the momentum to breach the ambitious $1,000 threshold.
Stay attuned as we delve deeper into LTC’s potential trajectory.
Litecoin Price Prediction
From a technical perspective, Litecoin’s trading pattern indicates some uncertainty.
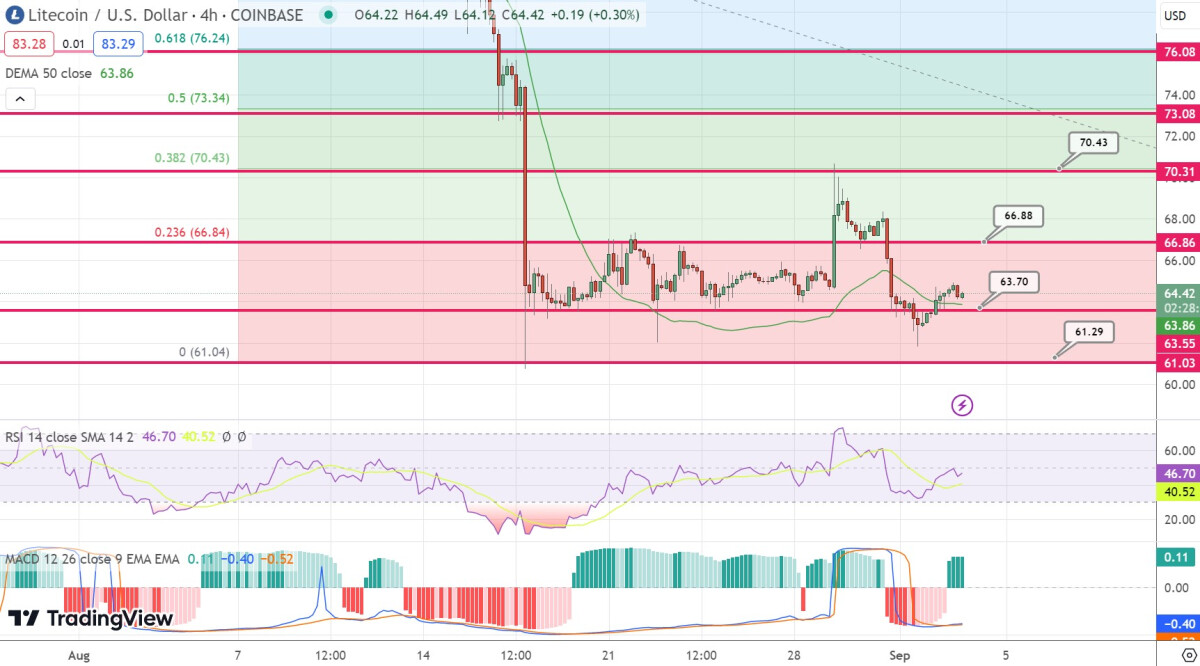
After its unsuccessful attempt to surpass the $65 resistance level, its consistent candle closures below $67, which corresponds to the 23.6% Fibonacci retracement, suggest that a price correction could be on the horizon.
Notably, the emergence of neutral candles such as dojis and spinning tops hint at indecision among investors.
Analyzing the four-hour timeframe, Litecoin’s price oscillates around the 50-day exponential moving average, further emphasizing the tug-of-war between bulls and bears.
Divergence is evident when comparing technical indicators like the Oscillator Indicator, Relative Strength Index (RSI), and the Moving Average Convergence Divergence (MACD).
The RSI, lingering below the 50 mark, insinuates a bearish sentiment. Conversely, the MACD, with its histograms above zero and displaying green bars, signals that bullish momentum might be gaining strength.
However, the disparity between these indicators reveals market uncertainty, suggesting investors seek a catalyst to guide Litecoin’s price trajectory.
Key support for Litecoin is anticipated around the $63.75 level, underpinned by the 50-day exponential moving average.
A decline beyond this could expose Litecoin to the $62.25 mark, with the significant $61 level acting as a potential stronghold.
On the flip side, a bullish crossover above $64.85 could pave the way for an ascent to $66.85. Beyond this, the 38.2% Fibonacci retracement level might pose a challenge, potentially capping gains near the $70.43 mark.
In summary, traders should closely monitor the pivotal $65 mark; a descent below may entice sellers, while a climb above could attract buying interest.
Wall Street Memes – The Alternative Coin Worth Considering
The cryptocurrency market is attracting interest from individual investors who are exploring different investment options. Among these options, WSM, a meme coin, has gained considerable attention due to its presale, which has generated much anticipation among investors.
Wall Street Memes, an online community popular for catering to these investors, is behind the coin.
Strong investor interest has been observed during the presale of Wall Street Memes, with over $300,000 raised on the first day and a total of $25 million so far.
Currently, WSM tokens are available for purchase at a price of $0.0337 during this presale period.
This presents an exciting opportunity for growth and should not be overlooked.
Get involved in Wall Street Memes now and become part of this rewarding and thrilling venture.
Buy $WSM Here
Disclaimer: Crypto is a high-risk asset class. This article is provided for informational purposes and does not constitute investment advice. You could lose all of your capital.
Read the full article here


Leave a Reply