My investment process starts with this assumption: ANY investment can go up in price at ANY time. So when I looked at some charts of the major market indicators, I don’t eliminate any possible outcome. This is one of the most dangerous times in my 30-year investing career to make ANY all or nothing conclusions about the broad market, or major sub-segments of it. OK, with that out of way, let’s see where these charts lean, and what odds the current environment is giving us in a range of investment areas.
Note that rather than use the very detailed, more “busy” charts I use all day, I am conveying these conclusions through the great YCharts embedded charting feature Seeking Alpha provides to us. It’s a cleaner, simpler view.
SPY: teetering but still quiet…too quiet

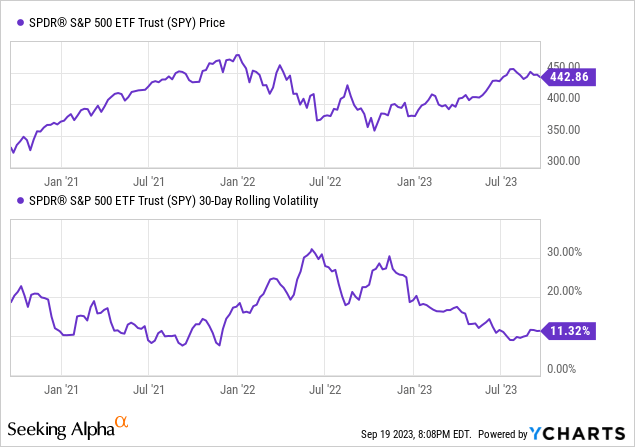
The chart above is a three-year look. I see a market that, beyond a trader’s time frame, has gone nowhere since mid-2021. The old high around $480 has been threatened, but not seriously. I can picture a continued stagnant stock market that by next spring has not moved radically in either direction. That would lead to headlines all over that sound like this:
“Stock market a big fat zero for three years, investors consider bonds and T-bills”
In fact, that’s what I’d probably write! Except the last part could be written right now. The stock market has to prove there is some inertia in order to steal some capital back from 5% T-bills and the increasing “yield curve creep” that has two-year bonds yielding 5.1% and even the three-year at 4.8%, the hurdle for equities to have as big a piece of portfolios is much higher than in the past. This is likely not lost on big-money institutions like pension funds, which are driven by the long-term obligations they have to workers. Having virtually no risk while getting 5% return or even 4% is bound to move more money out of equities.
The bottom of that SPY chart shows that the rolling 30-day volatility, essentially the VIX indicator, for SPY is hovering near its late 2021 level. Last time, that was followed shortly after by a 25% SPY decline. I don’t like the reward/risk tradeoff here.
But again, that does not mean I hold no equity exposure. It is just much lower than usual, and with put options and a set of non-correlated ETFs around it (and plenty of T-bills) which make it so that if SPY falls hard, I am set up to profit And if it rallies by a double-digit percentage the remainder of the year, I’ll get a slice of that, and can adjust the mix more bullish if the technicals show something notably more positive than they do currently.
QQQ: fading slowly
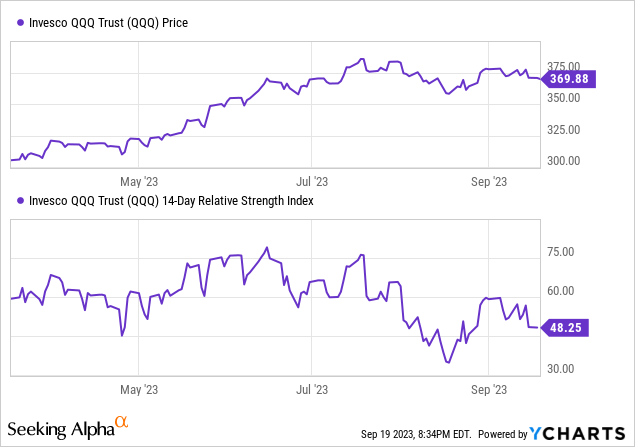
This has been the market leader…for like a decade. But especially the past few years. But its momentum is fading, as shown below. It is flat since late June, which might just be another “pause that refreshes.” But there’s a strong chance the QQQ love fest is stalled, and investors should be very careful assuming that dip-buying will produce anything better than trading range price moves.

ARKK: why are we still even talking about this?
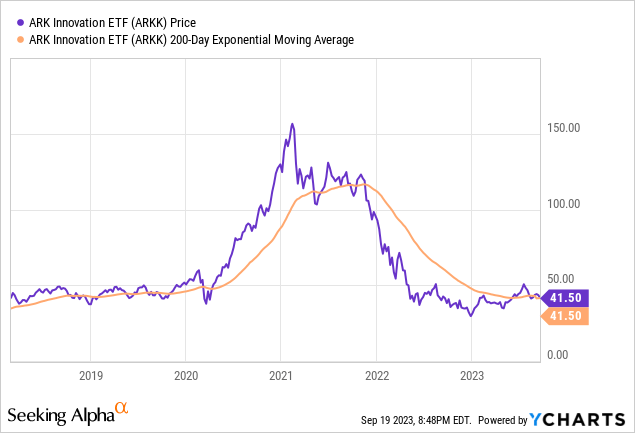
I guess I should answer my own question, since I brought it up. The chart below, of the popular (with investors and the media) ARKK ETF has become a proxy for “innovative growth companies.” So why then, is its price right where it was when this chart started? And when did it start? March 2, 2018!
That’s right, Cathie Wood fans. It has been 5 1/2 years of nothing. This is one of my major concerns about the investing era we are in, and why the stock market needs to fall hard in order for a “market clearing” to take place. It happens in every cycle, and obviously, it has already happened to ARKK.
Adding insult to injury here, ARKK just came down to its 200-day moving average from above for the first time since late 2021. It was a “canary in a coal mine” for a broader market decline back then, and the shorter-term, more detailed charts I look at say “high risk now” for this one. ARKK is not just about the collapse of some pandemic era darlings of the stock market. It also shows us that when you go beneath the surface, below the FAANG stocks and a small portion of the overall market, there is a mix of bad and mediocre. It just hasn’t followed through in the “headline” indexes like SPY and QQQ yet. So the emotional component (sentiment) is still hanging in, for now.

Oil: brief stall possible, but big potential for “Texas Tea”
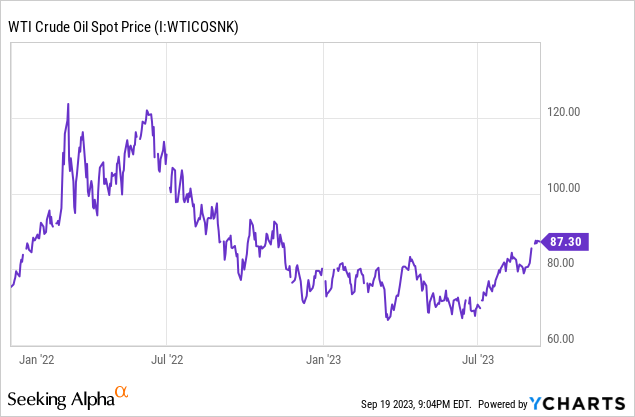
No fancy drawings on this chart below, which shows the daily price of West Texas Intermediate (WTI) Crude Oil. What you don’t see on this graph is that oil spend decades below $40. More recently, it surged to $120, then crashed before rallying hard, even touching $90 briefly for the first time since late last year. Oil has a lot of reasons to rally from a fundamental standpoint. And to me, it represents a potential leader in the “second coming” of inflation, a la the 1970s, when inflation came on the scene, receded, then re-accelerated, which wrecked the economy for a decade.
I’m not assuming anything, especially when it comes to a geopolitically-charged asset like crude oil. But this chart has the makings of a volatile, but ultimately much higher run in what they referred to as “Texas Tea” in the old Beverly Hillbillies TV comedy series. Oil has cleared some important price hurdles, and the $100-$120 range is in play later this year and into Q1 2024.

When I put it all together, I see a market that can, of course, always continue higher. But in the hundreds of charts I track every day, the “story” I’m getting from the market is that risk of major loss is creeping up, and has been for a while. It can already be seen in major drops in several key sectors, which I’ll likely address in an upcoming article.
Inflation, recession, student debt, government shutdown, housing market peaked, unemployment ticking up, China and Japan flailing economically, and long-term bond rates on the verge of breaking out higher. That’s plenty of risk to explain why risk is high. But that’s akin to talking a good game.
The ultimate wealth creator and destroyer is all about price. Specifically, the price of what you own, when you own it. And right now, the stock market looks very risky compared to the reward potential for the next several weeks to months. The weaker links in the stock market (ARKK etc.) are already wounded, and oil is hinting that inflation may make a second trip to investor-land.
This is a great time to learn more about:
1. Single Inverse ETFs to hedge and exploit down markets
2. T-bill ETFs to wait to fight another day, or year
3. Covered call ETFs as a unique and helpful tool in stagnant or volatile markets
4. Tactical portfolio construction to put it all together, rather than “buy and hope” or expecting to thrive in this market climate by diversifying stocks with other stocks.
Be careful out there!
Read the full article here


Leave a Reply