Introduction
Several weeks ago, I wrote XMHQ Is Seeking Alpha’s Top Ranked Mid-Cap Blend ETF!, which reviewed the best Mid-Cap Blend ETF as ranked by Seeking Alpha. The XMHQ ETF uses multiple quality factors to pick and weight their portfolio. At that time, the Vanguard U.S. Quality Factor ETF (BATS:VFQY) was ranked 5th. VFQY, now ranked second, determined by Seeking Alpha’s proprietary Quant Ratings. These five ETFs are the ones currently with a Buy rating from that process.

seekingalpha.com Quant System grades
After reviewing VFQY, I gave it a qualified Buy rating, and I listed my reasons/concerns at the end of this article. Along with analyzing the VFQY ETF, I provide some comparisons to the Invesco S&P MidCap Quality ETF (XMHQ), still rated as the best in the Mid-Cap Blend segment, being that it also follows a Quality strategy.
Vanguard U.S. Quality Factor ETF review
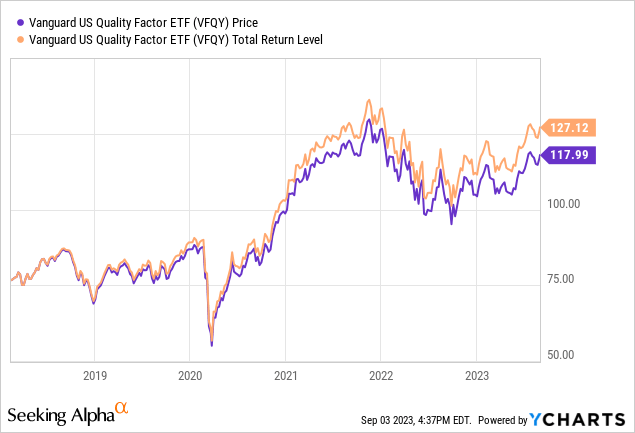
Seeking Alpha describes this ETF as:
The Vanguard U.S. Quality Factor ETF seeks to provide long-term capital appreciation by investing in stocks with strong fundamentals as determined by the advisor. The fund invests primarily in U.S. common stocks with the potential to generate higher returns relative to the broad U.S. equity market by investing in stocks with strong fundamentals as determined by the advisor. It seeks to benchmark the performance of its portfolio against the Russell 3000 Index. VFQY started in early 2018.
Source: seekingalpha.com VFQY
VFQY has $345m in AUM and sports a usual low Vanguard fee of 13bps. The TTM Yield is near 1.5%.
As does its benchmark, the Russell 3000 Index, VFQY invests in all market-cap sizes, though as will be shown later, big differences. As Vanguard explained, held stocks exhibit strong profitability and healthy balance sheets, as the ETF seeks long-term capital appreciation. As for the factors used, for financials the Quality factor is measured by return on equity and share issuance, and for non-financials, the Quality factor is measured by return on equity, gross profitability, change in net operating assets, and leverage.
Holdings review
Vanguard provides a comparison of sector weights for both the ETF and the Russell 3000 Index.
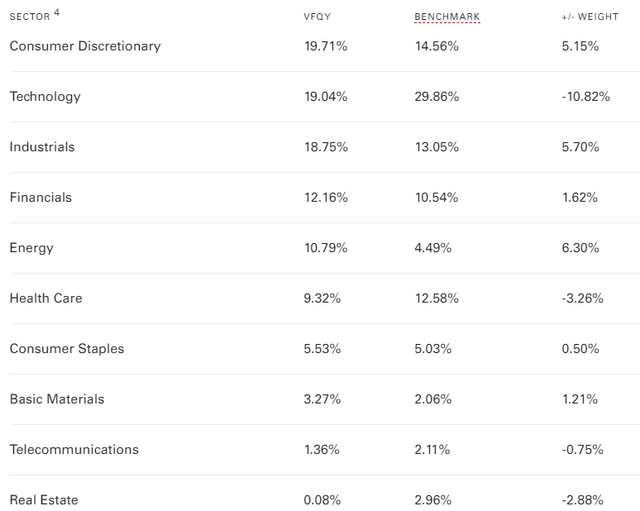
advisors.vanguard.com sectors
As one might expect, using Quality factors reduces the exposure to Technology stocks (-10.82%) and results in a +5% exposure to Consumer Discretionary, Industrials, and Energy. VFQY investors need to embrace those shifts to prefer VFQY over a Core ETF like the Vanguard Russell 3000 ETF (VTHR).
The Top 20 holdings are also the ones with a 1% or greater weight within the portfolio of just over 400 stocks. They represent 26.5% of the total weight, the same as the smallest 268 (65%) of the portfolio represent.
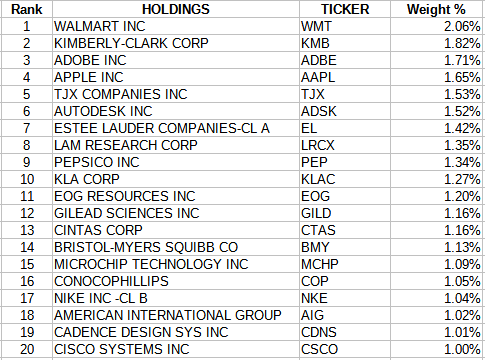
advisors.vanguard.com holdings
Another effect compared to VTHR is the dampening of the largest individual weights within the ETF. A prime example is Apple (AAPL), dropping from over 6% to just over 2% here.
Distributions review

seekingalpha.com DVDs
Payouts each year are climbing, but with a 1.4% yield, I cannot imagine that playing a role in why any investor would own VFQY. The ETF scores an “A” grade based on the growth, not the small yield.
VFQY versus #1, the XMHQ ETF
While I included some data from two benchmark ETFs, the real comparison I want to emphasize is between the two Quality ETFs, not VFQY against its benchmark ETF. First, a brief description of the XMHQ ETF as provide by Seeking Alpha and Invesco.
The investment seeks to track the investment results (before fees and expenses) of the S&P MidCap 400® Quality Index, which is composed of a subset of securities from the S&P MidCap 400® Index. XMHQ started in 2006.
Source: seekingalpha.com XMHQ
XMHQ has $1.1b in AUM and costs investors 25bps in fees. The TTM Yield is only 1.14%. The underlying S&P MidCap 400 Quality Index uses three factors to select and weight the 80 included stocks out of the wider 400 Index; those being accruals ratio, return on equity, and financial leverage. Each component is weighted based on the combination of its assigned quality score and its float-adjusted market-cap.
For the Style boxes, I also included the Vanguard Russell 3000 ETF (VTHR), based on VFQY’s benchmark, plus the MidCap 400 ETF (MDY) as that is the benchmark used by XMHQ. Here is some basic data on all four.

advisors.vanguard.com

advisors.vanguard.com
When comparing VFQY and XMHQ, they differ in market-cap allocations, as might be expected due to the different focus of each benchmark used. That said, VFQY doesn’t align well with VTHR, which uses the same benchmark, having an average market-cap of only $18b, compared to VTHR’s $137b. Unlike XMHQ, VFQY went “smaller” to populate its ETF compared to the benchmark ETF. XMHQ has a lower Value allocation and higher Growth allocation than VFQY does, with XMHQ’s Growth above its benchmark ETF compared to VFQY’s being below its benchmark ETF.
Another difference is the number of stocks held, with VFQY at over 400 and XMHQ under 80, so while 50% of XMHQ’s stocks are in VFQY, only 10% goes the other way. There are also a few large sector allocation differences between the two Quality ETFs.
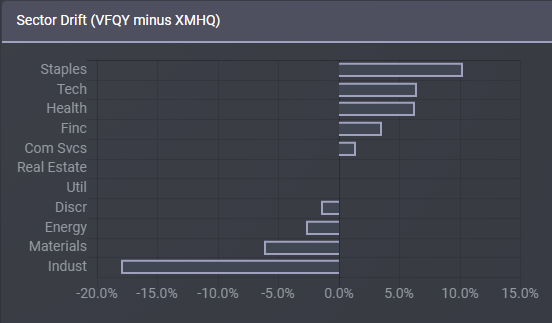
ETFRC.com
Five of the nine sectors have differences greater than 5%, with Consumer Staples (+10%) and Industrials (-17%) being the largest. Along with VFQY’s higher focus on Large-Cap stocks, an investor’s opinion on the sector allocations will play a major role in choosing between VFQY and XMHQ.
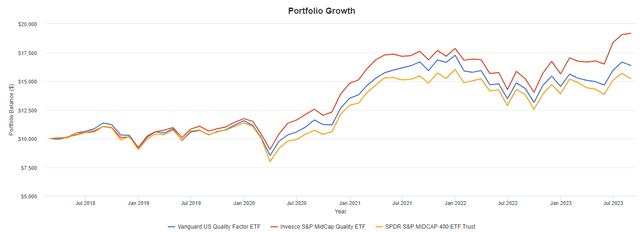
I chose to exclude the VTHR ETF next as personally I don’t think it is the right benchmark for VFQY to be measuring itself against based on their market-cap allocation differences. I did include the MDY ETF as the better non-factor Mid-Cap ETF to compare the Quality-factor ETFs too. VFQY’s short history limits the data available.
PortfolioVisualizer.com
Since 2018, both Quality-factored ETFs have outperformed the benchmark ETF represented by the MDY ETF, with XMHQ having a much better past year than VFQY is having.
Portfolio strategy
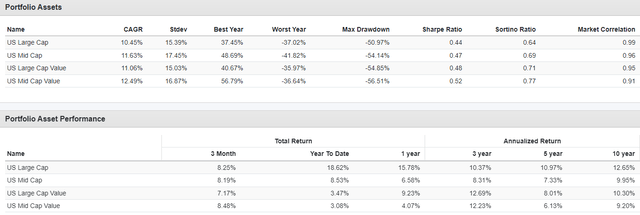
Based on the size of popular ETFs, investors are flocking to Large-Cap stocks. The biggest ETFs all focus on that segment of the US stock market, with over $1.6t in AUM. Placing 12th is the first Mid-Cap ETF on the list. I am sure some of that interest comes from the fact Large-Cap stocks have both outperform and dominated the stock market news over the past decade. As the next chart shows, Mid-Cap stocks have better results when including more history
PortfolioVisualizer.com
The top set of data goes back to 1972 and shows over that 50+ year period, both Mid-Cap overall and Mid-Cap Value stocks especially have treated investors the best at both the CAGR level and the return per unit of risk taken. As expected, the picture from parts of the past decade show mixed results.
Final thoughts
History has shown Mid-Cap and MC Value stocks have provided superior returns. As Seeking Alpha and Morningstar do, despite VFQY using a Total Market index as its benchmark, I also view it and XMHQ as Mid-Cap Blend ETFs. While I included Value data results above, as quality and value are commonly linked, allocations in both ETFs are concentrated in stocks labeled as Blend. So where does this leave investors? Both the VTHR ETF and MDY ETF are good Core holdings for their respective market-cap strategies. In picking between VFQY and XMHQ as a Quality-focus ETF to gain Alpha with, I gave XMHQ a Buy rating in my recent article, and while I give VFQY a qualified Buy rating as investors need to look closely at XMHQ before picking VFQY for the following concerns/reasons I have with the VFQY ETF, which they might feel differently about:
- Limited history (just over 5 years) to prove its strategy works long term
- Disagreement on the benchmark used to measure itself against
- Holding over 400 stocks in a factor-based ETF
- Allocation difference with XMHQ, mainly in sectors
Read the full article here


Leave a Reply