Defiance S&P 500 Enhanced Options Income ETF (NYSEARCA:JEPY) created a lot of hype when it launched a few months ago, looking to deliver outsized returns and outsized dividend yield generated by selling daily options. The idea was simple: there are 250 trading days in a year and daily options yield about 0.25% so if you sell daily options you can generate a yield of 50-60%. The fund’s first two monthly dividend distributions even provided an annualized yield of 59% (even though most of it was just return of capital), but the fund seems to have changed its strategy significantly in recent weeks, which could affect its returns significantly.
JEPY Annualized Distribution Yield (Defiance ETFs)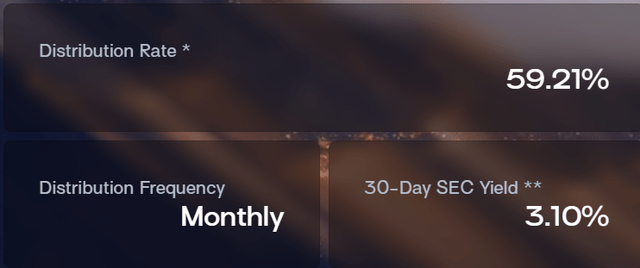
When the fund first launched, its documents said that it would sell put options up to 5% in the money in order to not only generate income but also partake in any upside up to that amount. There are even some interviews done with the fund’s management where the fund’s principal says this numerous times. As a matter of fact, in the first two months of the fund, it generally sold options with a strike price of 1-2% above the current price. So the fund could participate in upside moves up to 1-2%. This was a huge selling point of the fund because it wasn’t leaving all upside on the table.
This all changed this month, though. For the last 2 weeks the fund only seems to sell at-the-money put options which leave out all upside on the table and the fund couldn’t have done it at the worst time since we witnessed the market rally pretty strongly during this period. Below is how the S&P 500 (SPY) performed during this time.
SPY Performance (Investing.com)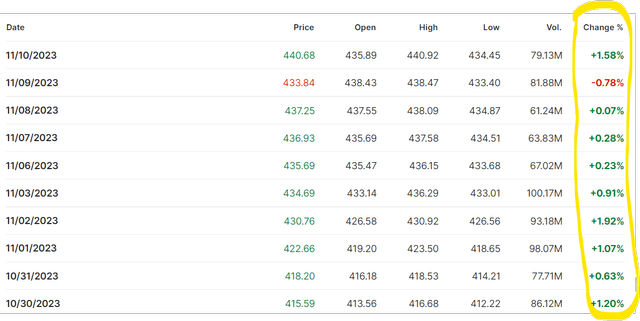
Now let’s look at how JEPY performed during the same period. First, please ignore the -4.31% performance on November 1st because it was the ex-dividend date for the fund where the distribution amount was subtracted from the share price. But besides that, notice how the fund only seems to rise only about 0.3% on days when SPY is up 1% or more. Only November 2nd, SPY was up 1.92% while JEPY was up only 0.22%. On November 10th, SPY was up 1.58% while JEPY was up 0.56% and so on. Interestingly enough, on November 9th when SPY was down -0.78%, JEPY was down -0.83%. Basically, the fund participated in all of the downside but only a fraction of the upside.
JEPY Performance (Investing.com)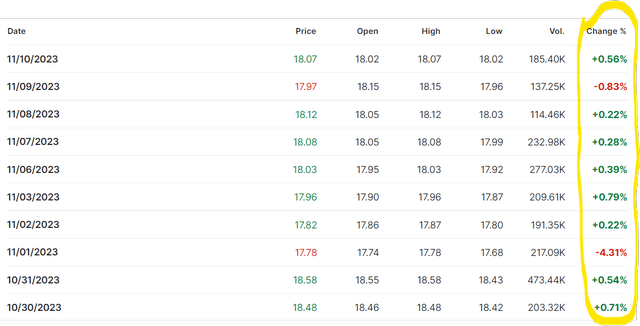
There were two things that created the appeal of this fund and set it apart from other covered call funds. First, it was selling daily options whose value decays very quickly, providing opportunities to create more yield at shorter timeframes. Second, it was selling options 1-2% above the current price, so investors could participate in any upside up to 1-2%. If the market was totally flat every single day and the fund just collected its daily premiums of 0.3-0.5%, that would be great, but that’s rarely the case. The market constantly fluctuates up and down, and one would have to participate in the upside and limit their exposure to the downside to be successful.
Why is this important? To demonstrate this, I pulled daily performance data of S&P 500 for the last 10 years encompassing a total of 2523 trading days. Of those trading days, 54% were green and 46% were red. This is important to note because 9 out of the last 10 years were spent in a bull market and even in this environment only slightly more than half of the days were green, and we had almost as many red days as green days. In total, 39% of the days were green by at least 0.25% or more and 31% of the days were red by at least -0.25%.
Trading Days in the Last Decade (The Author)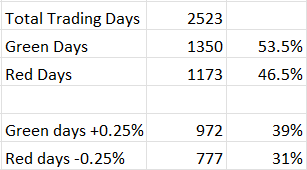
If on a given day, the market is only slightly more likely to have a green day than a red day, then whether you sell options 2% in the money, 1% in the money or at the money should make no difference, right? Well, it actually makes a lot of difference. In the last 10 years, we’ve had a total of 61 days where SPY rose by 2% or more. This doesn’t seem like much, but the market was up a total of 189% during those 61 days, so if you missed those days, you would have missed out on a big chunk of last decade’s bull market. During the same period, we had a total of 338 days where SPY rose 1% or more and those days provided a combined return of 566% which is even bigger than the market’s total return during this time because this excludes any red days.
Days the Market Rose 1% or More (The Author)
The point is, if you sold options at the money, you’d be missing out on those green days and if you sold options 1% above the current price, you’d still miss out on a lot of gains and leave a lot of money on the table. If you sold options that are 2% above the current price, you wouldn’t miss out on all of those 189% because you’d claim all gains up to 2% which would mean you’d only miss out on 67% of those gains (because you’d have collected 122% during those 61 days with a 2% cap on each day). If you sold out options 1% out of money, you’d be collecting 338% of capital gains on those 338 days and still miss out on about 228% of gains, but it’s better than missing out on all 566%. If you sold options right at-the-money, you’d miss out on all those gains.
On the downside, you’d be participating on most of those red days. In the last decade, we’ve had 281 red days where the market dropped by 1% or more. On those days, the average drop was actually -1.94% and the median was -1.60% because we had many days where the market dropped by several percentage points. When you sell daily options, you will be exposed to most of those drops, if not all. The 0.25% – 0.30% daily credit you are collecting won’t protect you much from a down day where the market drops by 2-3% or more.
Here is the funny thing. In a given year, there are about 135 green days and 117 red days. The average red day is -0.75% and the average green day is +0.72%. If you combine all the green days in a year excluding all red and flat days, you get a total gain of 97.2%. If you only combine the red days, you get a total loss of -87.8%. If you bought and held SPY, you participated in both green and red days and posted an average gain of 10%.
| Average Green Day | 0.72% |
| Total Green Days | 135 |
| Total move on green days | 97.2% |
| Average Red Day | -0.75% |
| Total Red Days | 117 |
| Total move on red days | -87.8% |
Source: The Author
But what if you only participated in most of the red days but missed out on most of the green days? Your results would be drastically different. Since JEPY collects about 0.25% per day in premiums, this totals about 63% in total premiums in a full year. This could offer a cushion against those red days where the market drops a total of -87.8% throughout the year, but you still need some upside to make up for the difference. For example, if the fund sold all options right at the money, it would be down significantly because it wouldn’t participate in any upside and only collect its premiums and participate in all down days minus the premiums it collected (87% – 63% for a loss of 24%).
If the fund sold options 1-2% above the current price, it could participate in many of those green days to make additional gains, which would move it to the green territory. The market doesn’t go up or down in a straight line, but it has a lot of up and down days. If you participate in almost all down days, you also have to participate in most up days in order to get ahead. You can’t get ahead by not participating in green days.
In recent weeks, the fund switched from selling put options that are 1-2% above the strike price to selling put options that are right at the money and left a lot of gains on the table as the market raged higher. If this continues, it will pave the way for the fund to underperform in the future.
Another thing the fund could actually do is sell covered option spreads, which would reduce the overall premium collected but allow it to participate in the upside above the strike. For example, let’s say SPY is at $440 and JEPY sells a covered call spread of $440-$443. It would collect a smaller premium than selling $440 options alone, but it would also participate in any upside above $443. That way, it wouldn’t be caught off guard on those days where the market suddenly decides to climb 2-3% or more on one day when no one was expecting.
Covered Call Spread Profit-Loss Profile (Options Profit Calculator)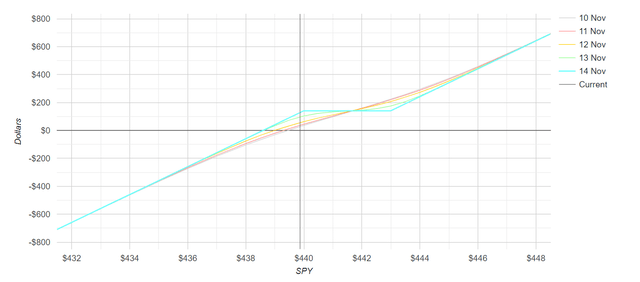
Read the full article here


Leave a Reply