After a lower open to start the week, stocks have staged a pretty big intraday recovery (so far). One catalyst for the rally was a tweet by Bill Ackman saying his firm had covered its Treasury short, citing too much geopolitical risk and an economy weakening faster than current economic data suggests.
Why a weaker economy would spur a rally in stocks is a legitimate question, but we’ve all certainly seen stranger things in the market, and when markets become oversold, sometimes it doesn’t take much to spark a rally.
Monday’s rebound also coincided with the Nasdaq’s decline from the July closing high crossing the 10% threshold, and it’s not uncommon for an index in the midst of a decline to bounce at these round numbers, as they are where bargain hunters will look to deploy some dry powder.The Nasdaq is no longer officially in correction territory as we write this (10%+ decline from a closing high without a 10% rally in between), but we wanted to take this opportunity to look at historical trends for past Nasdaq corrections and see how the current period stacks up.
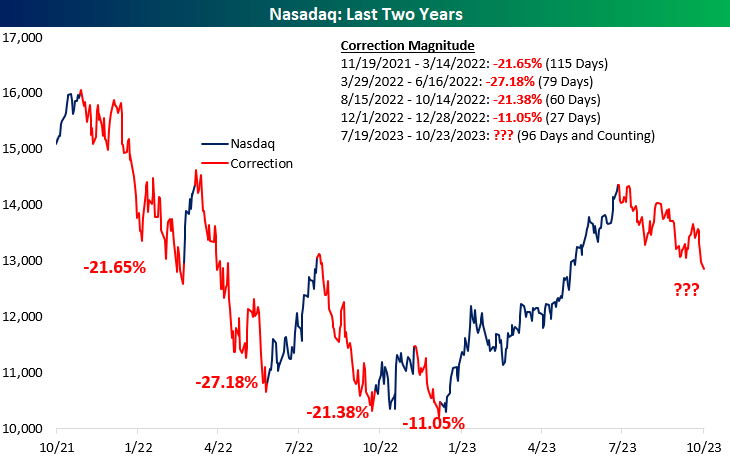
For starters, since hints of the current rate hiking cycle began, there have been four prior Nasdaq corrections. Three of the four were deep with declines of more than 20%, while the most recent before the current period was more tame at just 11%.

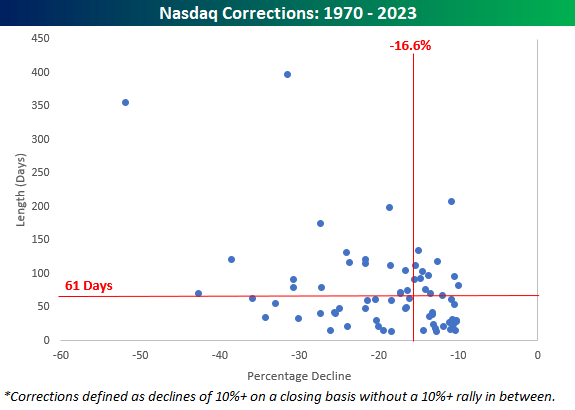
Looking at Nasdaq corrections from a longer-term window, the scatter chart below shows corrections in terms of their magnitude (x-axis) and length (y-axis).
Overall, the median decline of corrections since 1971 has been a drop of 16.6% over a median length of 61 calendar days. Through today’s close, the current decline is only around 10%, so it’s been a lot milder, but at 96 days, it’s already been 57% longer than the typical correction.
If the current decline in the Nasdaq were to reach the median level for a correction, that would take it down to just below 12,000.
The Nasdaq is known for being more volatile than the S&P 500, and when it comes to corrections, they have tended to be steep as opposed to gradual.
Even with respect to the corrections during the current rate hike cycle, three of the four prior ones were shorter than the current period. The only one that was longer lasted 115 days from 11/19/21 through 3/14/22.

Original Post
Editor’s Note: The summary bullets for this article were chosen by Seeking Alpha editors.
Read the full article here


Leave a Reply