
A Quick Take On Trident Digital Tech Holdings
Trident Digital Tech Holdings Ltd (TDTH) has filed proposed terms to raise $16.88 million in gross proceeds from the sale of its Class B common stock in an IPO, according to an amended SEC registration statement.
The firm provides digital transformation services to small and medium businesses in Singapore.
I previously wrote about TDTH’s initial IPO filing here.
Given the company’s falling revenue run rate, increasing losses, tiny revenue base and excessive valuation assumptions, my outlook on the IPO is a Strong Sell.
Trident Digital Overview
Singapore-based Trident Digital Tech Holdings Ltd enables SMBs in Singapore with e-commerce capabilities and digital optimizing and automation to improve their online results.
The firm is led by founder, Chairman and CEO Mr. Soon Huat Lim, who has been with the company since its inception in 2021 and has more than thirty years of business experience in a variety of relevant industries.
The company’s main offerings include the following:
-
Business consulting
-
IT customizations
As of June 30, 2023, Trident Digital has booked fair market value investment of $36,342. Shareholders have also advanced the firm $7.5 million in advance subscription payments from investors, including Trident Digital Tech Ltd., Trident Group Holdings, Tri Wealth, Soon Tai Lee and Yat Hong Lo.
Trident Digital Customer Acquisition
The firm seeks small and medium-sized customers from numerous industries but has focused its efforts on the industries of ‘e-commerce, food and beverage, fintech, healthcare and service, wholesale and retail’.
As of June 30, 2023, the company has served more than 200 clients in its history.
Selling expenses as a percentage of total revenue have risen sharply as revenues appear to be decreasing, as the figures below indicate:
|
Selling |
Expenses vs. Revenue |
|
Period |
Percentage |
|
Six Mos. Ended June 30, 2023 |
52.7% |
|
2022 |
19.1% |
|
2021 |
18.8% |
(Source – SEC)
The Selling efficiency multiple, defined as how many dollars of additional new revenue are generated by each dollar of Selling expense, has fallen to 0.0x in the most recent reporting period, a negative signal, as shown in the table below:
|
Selling |
Efficiency Rate |
|
Period |
Multiple |
|
Six Mos. Ended June 30, 2023 |
0.0 |
|
2022 |
2.5 |
(Source – SEC)
Trident Digital’s Market & Competition
According to a 2023 market research report by Mordor Intelligence, the Singapore market for Information and Communications Technology products and services is forecasted to grow by 8.2% from 2023 to 2028.
The primary reasons for this forecasted growth in demand are the launch of digital advancement projects, a continued rollout of 5G wireless standard capabilities, and government prioritization of the sector.
It is estimated the entire island of Singapore will have full 5G coverage by the end of 2025.
Also, the chart below shows previous government spending in Singapore on ICT initiatives:
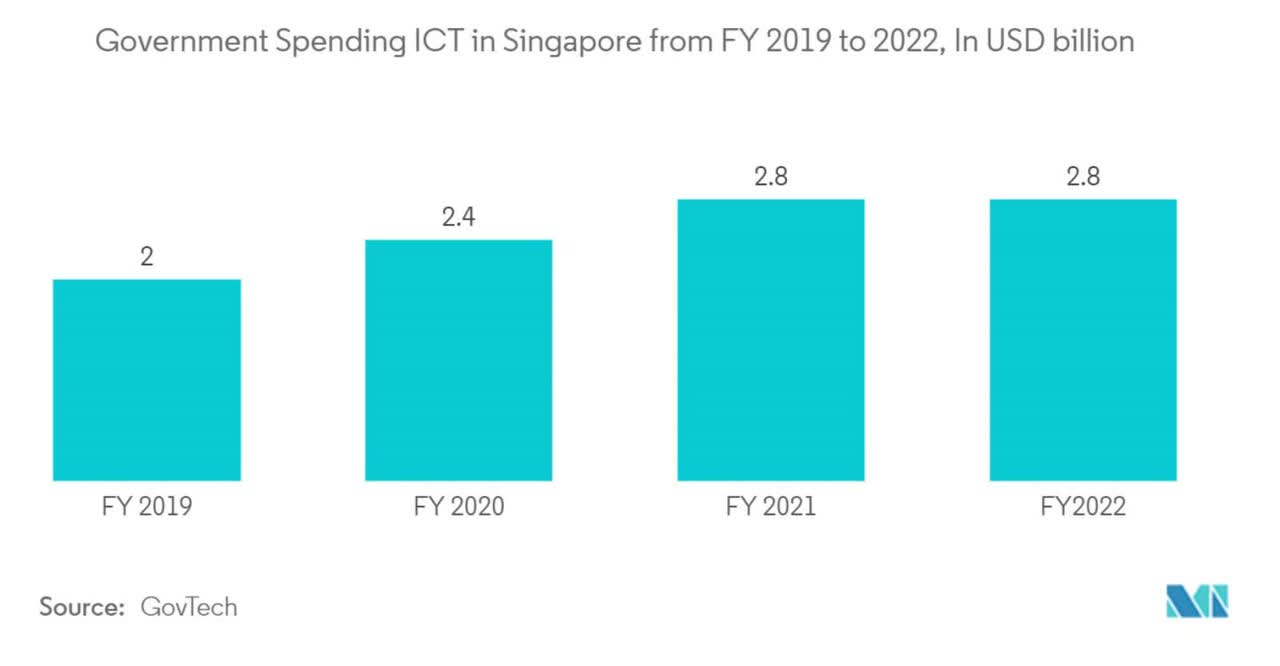
Mordor Intelligence
The digital solutions industry in the city-state of Singapore is fragmented, with low barriers to entry and a diverse customer base.
Trident Digital Tech Holdings Ltd Financial Performance
The company’s recent financial results can be summarized as follows:
-
Falling topline revenue (annual basis)
-
Reduced gross profit and dropping gross margin
-
Increasing operating losses and cash used in operations
Below are relevant financial results derived from the firm’s registration statement:
|
Total Revenue |
||
|
Period |
Total Revenue |
% Variance vs. Prior |
|
Six Mos. Ended June 30, 2023 |
$ 481,165 |
1.3% |
|
2022 |
$ 1,262,899 |
92.2% |
|
2021 |
$ 657,092 |
|
|
Gross Profit (Loss) |
||
|
Period |
Gross Profit (Loss) |
% Variance vs. Prior |
|
Six Mos. Ended June 30, 2023 |
$ 91,596 |
-4.8% |
|
2022 |
$ 262,210 |
30.8% |
|
2021 |
$ 200,447 |
|
|
Gross Margin |
||
|
Period |
Gross Margin |
% Variance vs. Prior |
|
Six Mos. Ended June 30, 2023 |
19.04% |
-1.2% |
|
2022 |
20.76% |
-31.9% |
|
2021 |
30.51% |
|
|
Operating Profit (Loss) |
||
|
Period |
Operating Profit (Loss) |
Operating Margin |
|
Six Mos. Ended June 30, 2023 |
$ (1,906,312) |
-396.2% |
|
2022 |
$ (1,256,486) |
-99.5% |
|
2021 |
$ (97,463) |
-14.8% |
|
Comprehensive Income (Loss) |
||
|
Period |
Comprehensive Income (Loss) |
Net Margin |
|
Six Mos. Ended June 30, 2023 |
$ (1,826,559) |
-379.6% |
|
2022 |
$ (1,166,971) |
-92.4% |
|
2021 |
$ 29,661 |
4.5% |
|
Cash Flow From Operations |
||
|
Period |
Cash Flow From Operations |
|
|
Six Mos. Ended June 30, 2023 |
$ (2,380,926) |
|
|
2022 |
$ (609,946) |
|
|
2021 |
$ 244,100 |
|
|
(Glossary Of Terms) |
(Source – SEC)
As of June 30, 2023, Trident Digital had $4.0 million in cash and $11.0 million in total liabilities.
Free cash flow during the twelve months ending June 30, 2023, was negative ($3.1 million).
Trident Digital Tech IPO Details
TDTH intends to sell 1.875 million shares of Class B common stock at a proposed midpoint price of $9.00 per share for gross proceeds of approximately $16.9 million, not including the sale of customary underwriter options.
No existing or potentially new shareholders have indicated an interest in purchasing shares at the IPO Price.
Founder Lim, the sole Class B stockholder, will be entitled to sixty (60) votes per share. Class B shareholders will be entitled to one vote per share.
The founder will have voting control of the company immediately post-IPO, and the company will be considered a ‘controlled company’ by Nasdaq’s rules.
The firm will also be a ‘foreign private issuer’ and an ’emerging growth company’; both designations will enable it to provide materially less information to public shareholders.
Such company stocks have generally performed poorly post-IPO.
The S&P 500 Index no longer admits firms with multiple classes of stock into its index.
The company’s enterprise value at IPO (excluding underwriter options) will approximate $451 million.
The float to outstanding shares ratio (excluding underwriter options) will be approximately 3.6%.
Management says it will use the net proceeds from the IPO as follows:
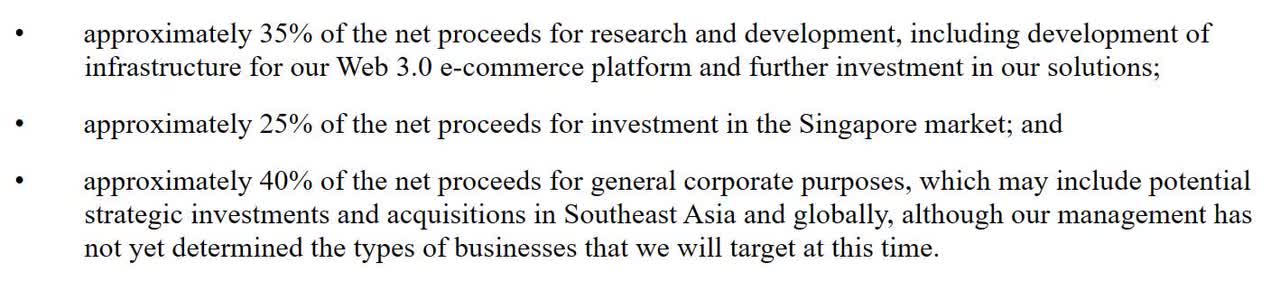
SEC
Management’s presentation of the company roadshow is not available.
Regarding outstanding legal proceedings, management said the firm may be subject to legal claims but that, in its opinion, the claims would not have a material adverse effect on its operations or financial condition.
The sole listed bookrunner of the IPO is US Tiger Securities.
Valuation Metrics For Trident Digital Tech
Below is a table of the firm’s relevant capitalization and valuation metrics at IPO:
|
Measure [TTM] |
Amount |
|
Market Capitalization at IPO |
$468,642,861 |
|
Enterprise Value |
$450,809,449 |
|
Price / Sales |
369.32 |
|
EV / Revenue |
355.26 |
|
EV / EBITDA |
-153.56 |
|
Earnings Per Share |
-$0.05 |
|
Operating Margin |
-231.36% |
|
Net Margin |
-223.83% |
|
Float To Outstanding Shares Ratio |
3.60% |
|
Proposed IPO Midpoint Price per Share |
$9.00 |
|
Net Free Cash Flow |
-$3,116,286 |
|
Free Cash Flow Yield Per Share |
-0.66% |
|
Debt / EBITDA Multiple |
-0.21 |
|
CapEx Ratio |
-19.38 |
|
Revenue Growth Rate |
1.27% |
|
(Glossary Of Terms) |
(Source – SEC)
Commentary About Trident Digital Tech
Trident Digital is seeking U.S. public capital market investment to fund its working capital requirements and corporate growth initiatives.
The firm’s financials have produced falling topline revenue (annual basis) from a tiny base, reduced gross profit and dropping gross margin and higher operating losses and cash used in operations.
Free cash flow for the twelve months ending June 30, 2023, was negative ($3.1 million).
Selling expenses as a percentage of total revenue have risen sharply; its Selling efficiency multiple fell to 0.0x in the most recent reporting period, a negative result.
The firm currently plans to pay no dividends and retain future earnings, if any, for reinvestment back into the firm’s growth and working capital requirements.
The company is a Cayman Islands-domiciled firm, so public investors would only have an interest in the Cayman Islands company and would not hold a direct interest in the underlying operating entities.
The firm’s recent capital spending history indicates it continues to spend on capital expenditures despite negative operating cash flow.
The market opportunity for providing digital transformation services is expected to grow at a moderate rate of growth in Singapore.
The company will likely seek to expand geographically outside of Singapore to operate in larger markets in the Asia Pacific region.
Business risks to the company’s outlook as a public company include its tiny size, highly variable revenue growth on a small base, and increasing losses.
Management is seeking an Enterprise Value / Revenue multiple of 355x.
Given the company’s falling revenue run rate, increasing losses, tiny revenue base and excessive valuation assumptions, my opinion on the IPO is a Strong Sell.
Expected IPO Pricing Date: To be announced
Read the full article here