The September CPI report will likely show that inflation remains well above the Fed’s target and increases the risk that the Fed will raise rates again following the stronger-than-expected job report.
The market now sees a nearly 50% chance that the Fed will raise rates again before this year ends. Meanwhile, the swaps market sees headline inflation staying above 3% through January, which will open the question of whether the disinflation trends witnessed in the first half of 2023 are now behind us as inflation stalls out.
Analysts median forecasts are for CPI to rise by 0.3% m/m, down from 0.6% in August, while rising by 3.6% y/y, down from 3.7% in August. Meanwhile, core CPI is expected to climb by 0.3% m/m in line with August and fall to 4.1% y/y from 4.3%.
However, most CPI models show headline inflation numbers will run hotter than analysts median forecast, with Bloomberg Economics nowcast projecting a 3.74% y/y change, while the Cleveland Fed and Kalshi project a 3.69%, and the CPI swap price in 3.55%.
Bloomberg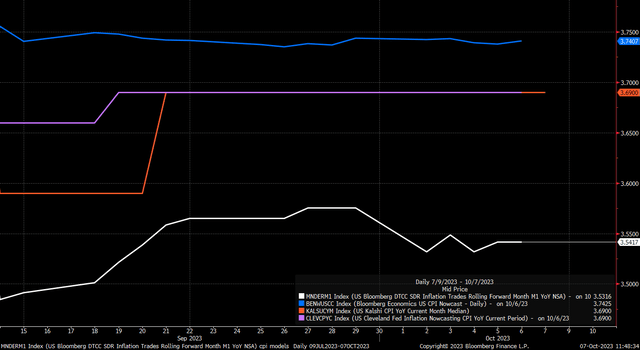
The models have done a decent enough job predicting inflation but tended to overshoot as the disinflationary trend took shape in the spring and early summer, but in August, we saw the CPI come in hotter than CPI swaps, Kalshi, and Bloomberg economics.
Bloomberg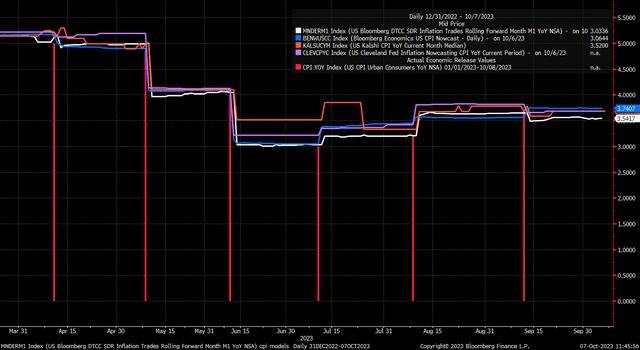
This is an important month because the market expects CPI on a year-over-year basis to fall to around 3.3% by December. However, inflation, measured through the CPI non-seasonally adjusted index, has been running at a faster-annualized rate of change through the first eight months of the year at about 5.2%. That means that the non-seasonally adjusted CPI index, which is the index used to measure the y/y rate of change, needs to show a very sharp deflationary trend from October through December, and if CPI should come in hotter than expected, as some of those models suggest, it means that inflation expectations for the rest of 2023 are too low and will need to rise.
Maybe it happens, maybe it doesn’t, but there appears to be a change in the overall trend in the CPI since the June report, generally running hotter than the market trend has plotted out.
Bloomberg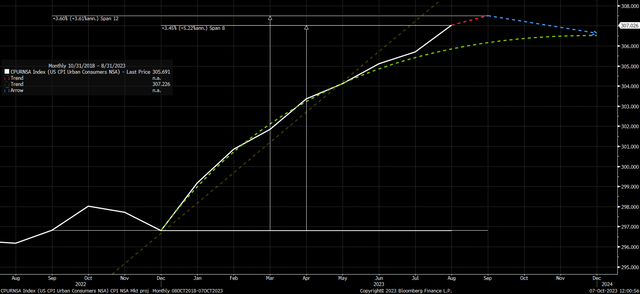
Bond Auctions
Additionally, this week, we will have a ten- and 30-year bond auction, which will take on some extra importance, especially given the recent volatility across the yield curve. A weak Treasury auction could ignite further upside risk to rates.
Trading View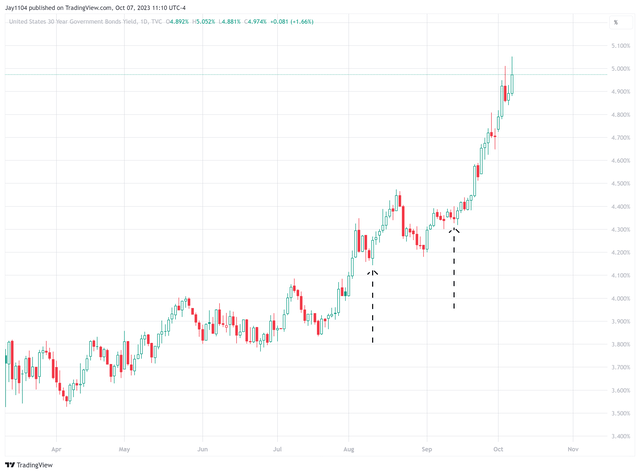
The last two 30-year Treasury auctions on August 10 and September 13 were important yield turning points. Both auctions lead to a sharp move higher in the 30-year rate in the following days. Mostly because these Treasury auctions weren’t strong and have come in with rates at or above the when-issued rate, and indirect acceptance rates have declined. For example, the 30-year Treasury auction in August had a when-issued rate of 4.17% but was priced at a high yield rate of 4.189%, which suggests that demand for the issue was weak. Meanwhile, in September, the then-issued rate was 4.34%, and the bond was priced at a high yield rate of 4.345%, but the indirect acceptance rate was 64.5%, well below the 67.8% in the August auction. Indirect bidders tend to be foreign buyers, and those acceptance rates have steadily fallen since June.
Bloomberg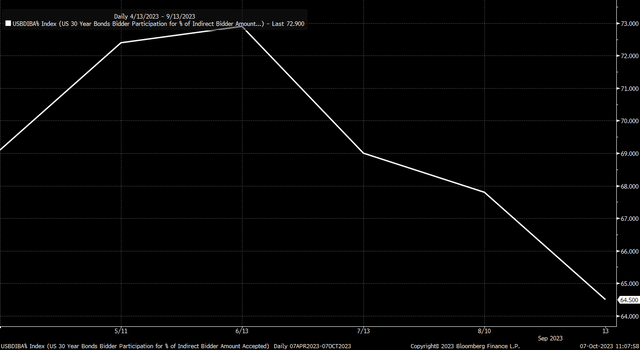
Stocks Follow Bonds
Certainly, the bond market volatility is very high right now, and the CPI report this week isn’t likely to settle that volatility down. The MOVE index, a measure of bond market volatility, spiked sharply in the last few weeks and rose to around 126. Bond market volatility could lead to further weakness in the equity market because the equity market has just been trading with volatility measures in the bond market and credit spreads. Lower implied volatility in bonds and narrower credit spreads help to lift equity prices, while higher volatility and wider credit spreads push equities lower. The earnings yield of the S&P 500 has been traced along with these bond measures.
Bloomberg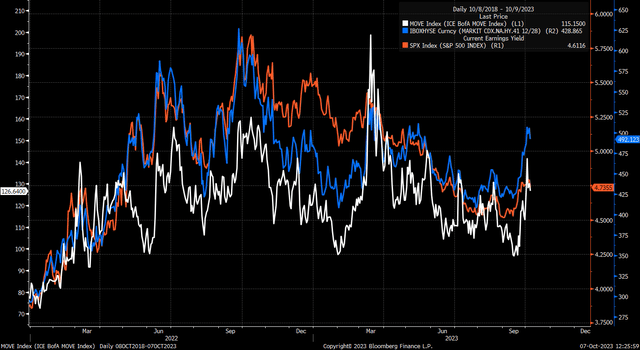
The volatility in the equity market on Friday was due to these outside forces, with the first being that big pop in Treasury rates following the big beat on the job report, which sent the S&P 500 futures sharply lower. Those rates started to come in, most likely as some trader began to cover their short positions, taking advantage of their gains—this led to spreads narrowing, which helped to lower implied volatility and push stocks higher.
Bloomberg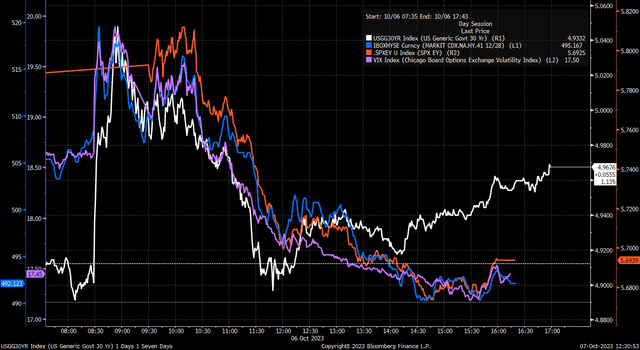
Heading into the job report, S&P 500 implied volatility was high at greater than 22%, and it was expected to drop to around 14.8% by Monday. So it was clear that once that jobs data came out, that implied volatility would decay, and that decay would power the markets higher at some point Friday. The big jump in the interest rates initially sent markets lower and delayed the implied volatility decaying, creating the equity market squeeze.
Bloomberg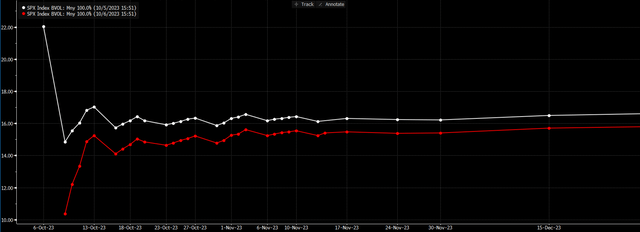
Even on Thursday, in a note titled “Waiting on Jobs” to members of my Seeking Alpha investing group, I noted that:
So the options market tells us that there is the potential for a 1% change in prices in the market tomorrow, and it also tells us that once the data comes out, it is likely we will see implied volatility decay, and that could initially lift the equity market higher, regardless of the data.
So, whether or not you think the equity market has bottomed and is due for a short-term bounce should be based on whether you think rates have topped out. The CPI data and the Treasury auction could give us the clues needed to make that determination. However, based on where Fed policy is and is likely to be, the shape of the yield curve, the rise in the term-premium, and a potential policy shift from the Bank of Japan, I think the trend in rates, for now, remains higher.
Read the full article here



Leave a Reply