TD SYNNEX (NYSE:SNX) is a solutions aggregator for the IT ecosystem. Since my last report, the stock hasn’t moved a lot; it is trading around the same level. It recently announced its Q3 FY23 results, and I will analyze the results in this report. I think there might be a slight correction from the current level. Hence, I would recommend avoiding it despite the undervaluation and adding the stock after a correction.
Financial Analysis
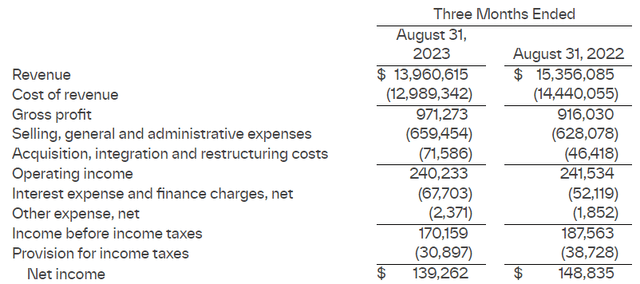
It recently posted its Q3 FY23 results. The revenue for Q3 FY23 was $13.9 billion, a decline of 9% compared to Q3 FY22. The decline was due to revenue decline in the Americas and Europe. The revenue from the Americas and Europe declined by 10.3% and 9.7% in Q3 FY23 compared to Q3 FY22. I think both these regions were affected due to lower demand for the endpoint solutions. Its gross margin for Q3 FY23 was 6.9%, which was 5.9% in Q3 FY22. The gross margin was benefited by a larger percentage of revenues produced from higher-margin, rapidly growing technologies.
SNX’s Investor Relations
The net income for Q3 FY23 was $139.2 million, a decline of 6.4% compared to Q3 FY22. A $16 million higher interest expense affected the income. The decline in revenues might show weakness, but honestly, I think the comparison with FY22 becomes quite difficult because, in FY22, the company saw a post-pandemic boom in PC ecosystem products demand, which boosted its revenue significantly, and in FY23, it witnessed a cooldown in the post-pandemic demand. So even though the revenue declined, I think maintaining the revenue growth even at this rate is quite impressive, and with only one quarter remaining, I think FY23 revenue will be quite lower than FY22 revenue, which I believe might not be an issue because in FY23 the company didn’t have post-pandemic demand tailwind. In addition, if we look at its revenue growth over the years, it has outperformed almost every competitor of its. So, even after a revenue decline in the current quarter, I think the result was decent.
Technical Analysis
Trading View
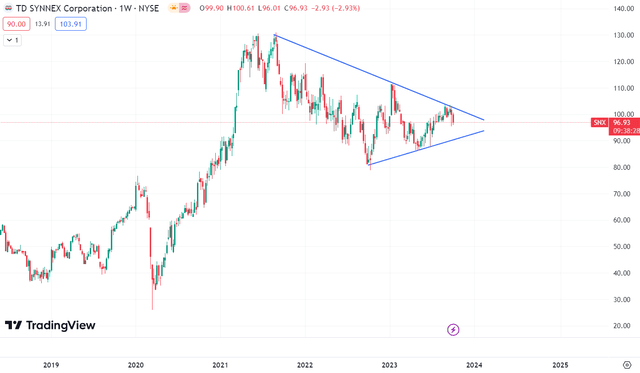
It is trading at $96.9 level. The stock hasn’t moved much since the last report. It is around the same level as it was in July. I can see a beautiful triangle pattern here. The stock is in a triangle pattern, and the stock has faced resistance from the upper trend line and is headed towards the lower trendline. Hence, one can initiate buying when it reaches around the lower trendline, which is at $91, because the lower trendline is a great support for the stock. The other reason is that the stock is looking great for the long term because there are signs of a trend reversal, like the break of the structure of lower highs and lower lows that I mentioned in the last report. Hence, I believe one can get it at a discounted price of $91. Hence, I would advise waiting for the stock to reach the $91 level, and once it reaches that, I think one can add it for the long term.
Should One Invest In SNX?
It is performing quite well and keeping up the tremendous sales growth it has seen over the previous two years. The current valuation also looks quite low. It has a P/E [FWD] ratio of 8.97x, which is lower than the sector ratio of 21.32x, and it is trading at a PEG of 1.07x, which is lower than the sector ratio of 1.8x. I think the company is trading at a significantly lower P/E multiple than the sectoral P/E; considering its solid financial performance and future growth estimates, I think the company should trade at a higher P/E multiple. A P/E multiple of 15x is suitable for the company, and with a non-GAAP EPS [FWD] of $10.81, it gives us a price target of $162. So, I think this stock provides a significant upside from the current level. But even though it provides a significant upside, I wouldn’t recommend investing in it as I think one can get it at an even more discounted price. The technical momentum suggests a slight correction. Hence, it would be better to wait and invest in it when it reaches the support line, which is at $91. So, looking at all factors, I assign a hold rating.
Risk
The company’s connections with a select group of OEM suppliers are crucial to its future success. For instance, the sales of products and services by HP Inc. accounted for around 10%, 12%, and 15% of their total revenue in the fiscal years 2022, 2021, and 2020, while the sales of products and services by Apple Inc. accounted for roughly 11% of their total revenue in the fiscal year 2022. Their OEM supplier contracts are often short-term and subject to immediate, no-fault termination. OEM supplier contracts are frequently created at the regional or national level, and these connections may change in some nations or regions but not in others. The termination or deterioration of their relationship with HP Inc., Apple Inc., or any other significant OEM supplier, the approval of additional distributors by OEM suppliers, the sale of products by OEM suppliers directly to their reseller and retail customers and end-users, or their failure to forge relationships with new OEM suppliers or to increase the distribution and supply chain services that they offer OEM suppliers could have a negative impact on their operations, finances, and reputation. Additionally, OEM suppliers can experience liquidity or solvency problems, which could severely impact their operations and financial performance.
Bottom Line
Even after a revenue decline, I think the quarterly result was decent. They are continuing on their steady upward trajectory, and I believe it provides solid upside potential in the long term. But the current momentum is suggesting a slight downside. Hence, I would recommend waiting for the correction and adding this stock on every dip. So, I assign a hold rating.
Read the full article here


Leave a Reply