The ETF market is constantly evolving to innovate new products to market to potential investors. YieldMax is juicing up the potential for income investors with its lineup of single stock options-based ETFs. With the moniker “Options For Your Income”, the family of funds covers several popular stocks such as Tesla (TSLA) and Apple (AAPL). The focus of this article is on YieldMax NVDA Option Income Strategy ETF (NYSEARCA:NVDY), which uses NVIDIA (NVDA) as its underlying.
ETF Overview
YieldMax NVDA Option Income Strategy ETF, as the name implies, utilizes options to implement an income-focused approach. This is clear when one reviews its current holdings.
NVDY Holdings (elevateshares.com)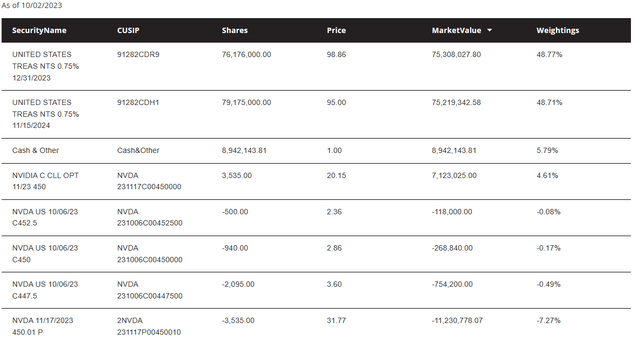
The first thing to notice is that the fund doesn’t own any shares of NVIDIA. It instead creates a synthetic position by simultaneously buying a call option and selling a put option at the same strike. Reviewing the current holdings shows that the current synthetic position is centered on the $450 strike. A synthetic stock position will mimic movement in the underlying stock. The second part of the strategy comes from selling shorter-dated call options against the synthetic stock positions. This is where the income from the fund is derived. Again reviewing the current holdings shows that short call options are primarily centered around the $447.50 strike. Given the covered call nature of the strategy, the upside gain from capital appreciation is limited to the short-dated call option strike while exposure to capital depreciation is 100%.
Note also that the use of synthetic stock positions could be used to create leverage but in this case, the available capital is invested in US treasuries. The fund is short 3,535 put contracts at the $450 strike. The notional value of these contracts is roughly $159 million compared to roughly $159 million in US treasury notes and cash.
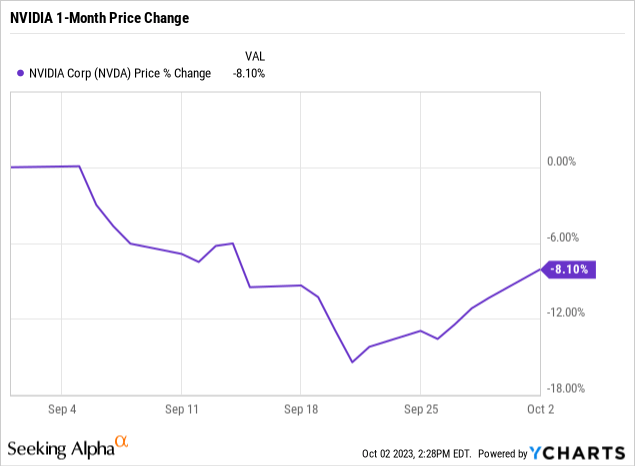
The expense ratio of 0.99% might be considered high for a simple strategy but the active management of the fund may be worth it. It appears management is pretty astute at picking call strikes anticipating what NVIDIA stock might do near term. Notice the selection of call strikes sold currently are $447.50, $450, and $452.50. The synthetic position strike is $450, suggesting fund managers didn’t anticipate any, or very little, upward trajectory in the stock. Turns out they’ve been right.
Performance
The fund hasn’t been around long, only being launched on 5/10/2023, but has performed well in its short existence. The following chart shows what can be expected when NVIDIA stock is performing well.
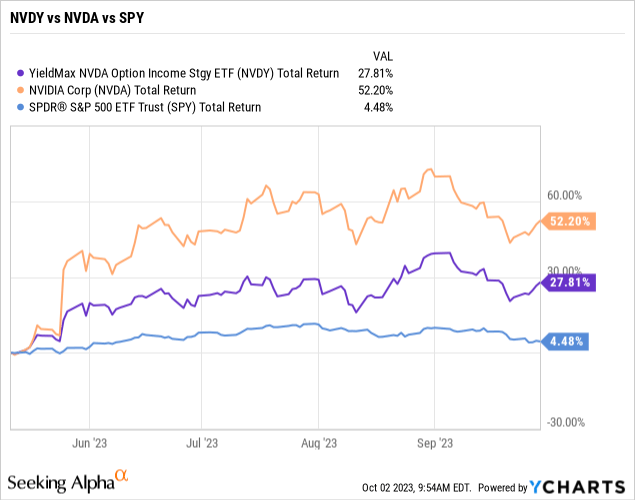
NVIDIA stock has been pushing over 50% return since May, while its derivative-based NVDY ETF has returned ~28%. The disparity in return is due to the upside-limiting covered call component of the fund. Since the fund sells short calls 5-15% out of the money, large quick movements to the upside in NVIDIA stock will be missed out on. The total return for the SPDR S&P500 ETF (SPY) is also shown for comparison.
It’s worthwhile to take a closer look at returns for NVIDIA stock over the last decade to gauge how a targeted 5-15% out-of-the-money call write compares to actual returns. The following chart shows the rolling 30-day return for NVIDIA stock over the past 10 years, representing over 2,500 data points.
NVIDIA 30-Day Returns (Michael Thomas)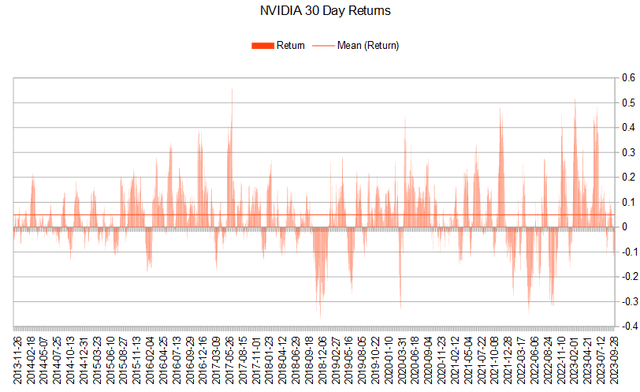
30-day returns are widely dispersed, with many hitting 30%, 40%, and even 50% on the upside and down to -30% on the downside. A tabular view of the data makes it easier to interpret and digest.
NVIDIA 30-Day Return Metrics (Michael Thomas)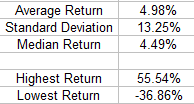
The average 30-day return of 4.98% compares favorably to the targeted 5-15% out-of-the-money short calls at first glance. However, the standard deviation of returns is quite high at 13.25%, over 2.5 times the average return, highlighting the sporadic and fast-moving nature of NVIDIA stock price. The probability of capturing most of NVIDIA’s price appreciation with a 5-15% out-of-the-money short call remains unclear. Taking a look at the percentile distribution of 30-day returns may help shed some light.
NVIDIA 30-Day Return Percentile Distribution (Michael Thomas)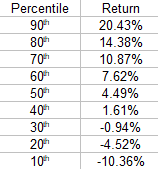
Interpreting the above percentile data shows that the top range of the short call target of 15% should capture around 80% of NVIDIA stock price movement. At the lower end of the target range of 5%, the capture moves toward 50%. We can conclude that generally, NVDY should capture between 50%-80% of NVIDIA price movement to the upside.
Distributions & Income Potential
So far, NVDY has distributed four dividends on a monthly schedule. If you bought the fund at $20 when it first launched, you would already have received $3.447 in dividends in four months. That represents over 17% of the original cost. The latest distribution was $0.9297 which went ex-dividend on 9/8/2023. That’s a 4.10% monthly yield, or 49.2% annual yield, based on the closing ETF share price of $22.60 at that time.
NVDY Dividend Distribution (Seeking Alpha)
The reason for the large yield is due to NVIDIA’s high implied volatility. Since selling call options is NVDY’s way of producing income, that income is largely dependent on implied volatility in the underlying. As seen in the following chart, NVIDIA has elevated implied volatility, which only dipped below 30% for a brief moment in late April but has largely been over 50% during the past year.
NVDA Call Implied Volatility (ivollatility.com)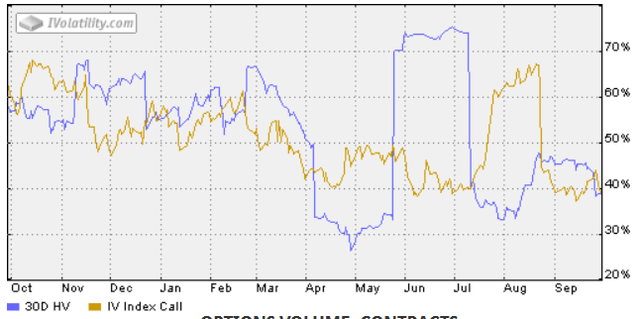
Comparing NVIDIA’s implied volatility to that of SPY puts it into perspective. The following chart shows implied volatility for SPY over the last year at less than half of NVIDIA’s over the period. Nvidia’s current Call IV of ~39% is almost 2.5 times SPY’s ~16%.
SPY Call Implied Volatility (ivolatility.com)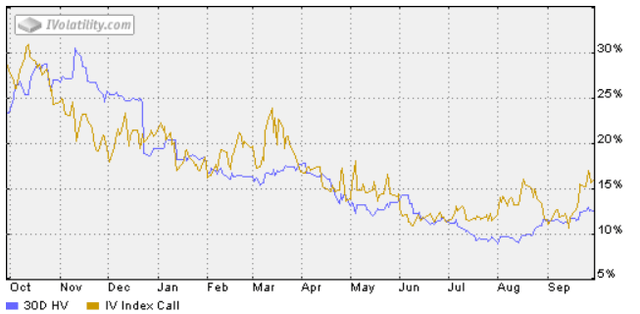
Risks
While NVIDIA’s combination of strong performance and higher volatility makes it a good choice to use as a base for a covered call strategy, there are specific risks and costs to keep in mind. The first is the opportunity cost associated with capping price appreciation. This is especially true with a stock like NVIDIA that can easily double in a short period. Investors in NVDY will need to disconnect from the stock and view it solely as an income-producing asset, nothing more, as the opportunity costs compared to owning the stock are significant.
The second risk is big declines in the underlying stock. The fund will continue to implement its strategy regardless of what the underlying stock does in any particular month. If Nvidia stock takes a nosedive and drops 50%, the fund is still selling calls at strikes 5-15% above the stock price every month, which could be 30%+ below what you bought the fund for. Sure, you’re still collecting income from short calls but the corresponding price appreciation cap is working against you in recovering your invested capital. Stock owners will recover capital losses much quicker than holders of NVDY in a V-shaped recovery.
Conclusion
The strategy employed in the YieldMax NVDA Option Income Strategy ETF certainly isn’t suitable for everyone. Investors with longer investment horizons are likely more inclined to just own NVIDIA stock. However, investors looking for current income with a higher risk tolerance could benefit from using NVIDIA’s high IV and strong performance through NVDY. Since the distribution yield is so high, even small allocations of NVDY to a portfolio can boost income while compensating for the reduced participation in the price appreciation of NVIDIA stock.
Read the full article here


Leave a Reply